
Injuries are an inevitable part of the NHL. An 82 game schedule guarantees that all teams are going to deal with injuries during the season but not all teams deal with them equally. Quantifying the impact of injuries is difficult. The introduction of better individual player impact stats gives us some new tools with which to approach this concept. In particular, DTMAboutHeart‘s Goals Above Replacement stat seems a useful place to start because it allows for estimating how many goals above replacement a team loses while a player is injured.
All injury data in this post comes from NHL Injury Viz. GAR data comes via DTMAboutHeart. Games played data comes from Corsica and standings data is via Hockey-Reference.
The following charts rely on a couple of assumptions. The first is that injured players minutes are given to replacement level players. This is not entirely true in most scenarios. If a top line player is injured, that players’ ice time will likely be distributed among players of different skill levels. A 2nd, 3rd and 4th line player will probably each take a couple of those minutes and then the remainder will fall on a new entrant into the lineup. So while assuming that all of the minutes go to replacement level players isn’t perfect, it does seem reasonable that the majority of those minutes will end up with replacement or close to replacement level players.
The second assumption is the way in which the injured player’s projected GAR is calculated. For simplicity, the estimate is based on the player’s GAR per game played in the season when the injury occurred as well as the previous two seasons if that data is available. If it isn’t, the estimate uses only the current and previous season or the current season alone.
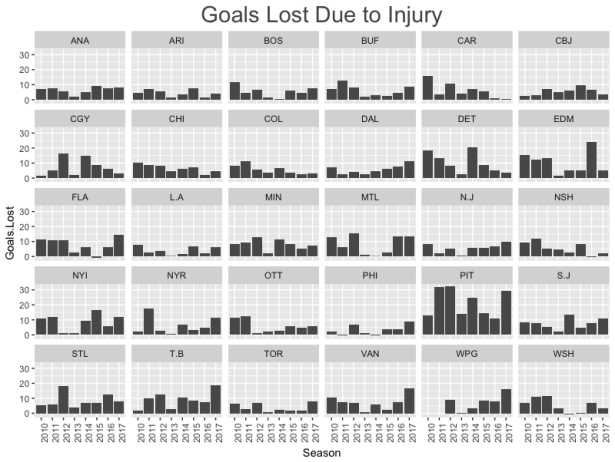
To start, the following chart shows an overview of each team’s GAR lost due to injury beginning in the 2007-2008 season and going through the 2016-2017 season. The first thing that jumps out is the Penguins. Injuries to Sidney Crosby, Evgeni Malkin, and Kris Letang put them far ahead of all other teams in this analysis. Contextually, the best teams would be expected to show the biggest effects by this measure. The Devils can’t show a big loss in GAR if they don’t have any players with a high GAR in the first place.
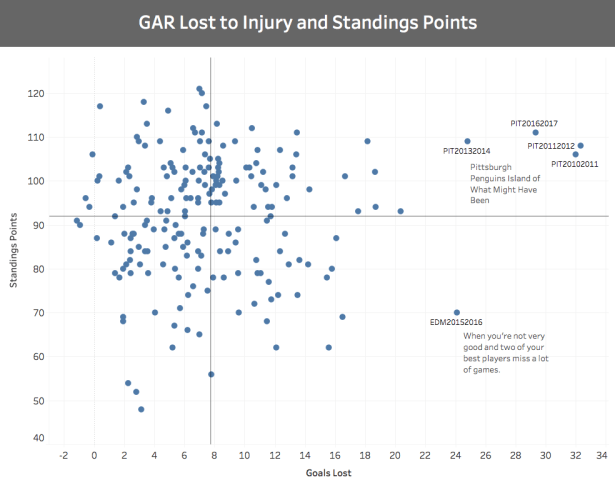
The next chart pairs the data above with the season outcomes. Again, the Penguins placement here is outrageous. They skew the entire scatterplot. Four times they managed to deal with significant injuries to star players and still keep winning. One of those times is this season. They weren’t able to win the cup in the previous three attempts. In a way, if they’re able to overcome the injury to Kris Letang and repeat as champions, this could be looked at as their most impressive run given the injuries they dealt with during the season.
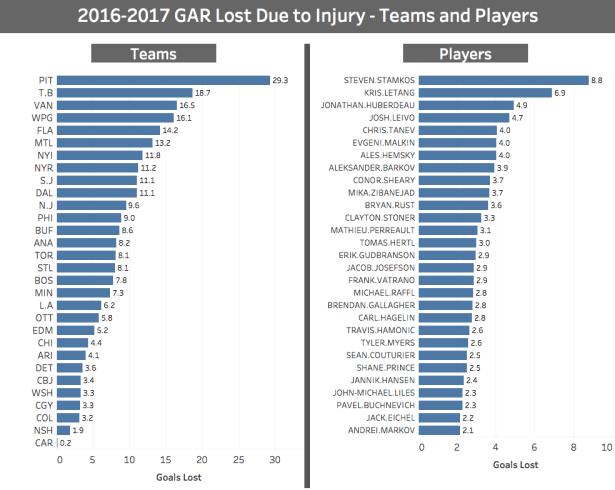
The following graphs shows a quick look at which teams and players had the worst seasons in terms of GAR lost to injury in 2016. Among teams, the Penguins had by far the toughest run of injuries. The worst was to Kris Letang but Evgeni Malkin also missed some time along with a slew of other players. The Lightning are second among teams mostly due to injuries to Steven Stamkos and Anton Stralman. The Jonathan Huberdeau and Aleksander Barkov injuries also stand out as likely being part of the reason that the Panthers struggled this season.
Similar to the previous graph, this one shows the worst team and skater injury seasons across the entire data set. Among teams, the Penguins have all of the top four worst injury seasons. Even acknowledging the talent level on the team, that seems like pretty terrible luck. After them is last year’s Oilers who lost both Connor McDavid and Oscar Klefbom for significant amounts of time. The 13-14 Red Wings nearly missed the playoffs due in part to injuries to Henrik Zetterberg and Pavel Datsyuk. This year’s Lightning are in 7th and did miss the playoffs.
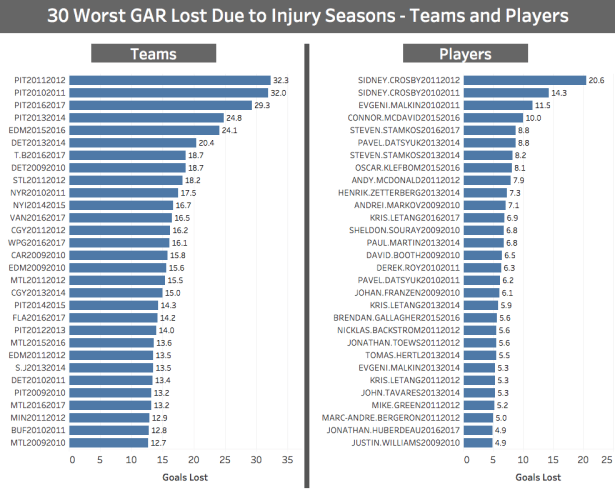
The amount that Crosby appears at the top of the skater graph is a stark reminder of just how much time he missed in the early part of this decade. He has erased any doubts about his ability to regain his spot as one of the top players in the game but looking at these numbers is a reminder of a time just a few years ago when it seemed realistic that he might never again be the player he was before the injuries.
Understanding how injuries impact team results is an interesting area for real research as opposed to this kind of simple analysis. Knowing the cost of injuries would give an indication of what is to be gained by avoiding them. Other sports are already deep into the use of sports science. Basketball is currently having a public debate about how frequently players can and should be rested to avoid injury and achieve optimal performance. These ideas will inevitably make their way to hockey. The teams that anticipate that and get ahead of the trend will gain greatest competitive advantage.

“better individual player impact stats.”
I thought DTM’s WAR Model provides predictive stats, not impact (value) stats. Can you clarify what you mean here? Thanks.
change the picture to a golden knights picture