
We recently released the final version of our contract projections for the 2019 NHL free agent class (they can be found here). Our initial projections went up in mid-April, and even though it’s only been a few weeks, we’ve had numerous questions about how the model was designed, how it works, what it means, etc. I thought we might be able to answer all the questions about it on twitter, but alas it was just a dream. A quick recap: this is our third year doing contract projections for the NHL offseason. While the model/projections this year may seem quite complicated, our first version was very simple: a few catch-all stats and a linear regression model to predict salary cap percentage (cap hit / salary cap). We use cap percentage to keep salaries on the same level as the salary cap changes. Over the last few years, we’ve developed a few new methods, and this year we took quite a bit of inspiration from the method Matt Cane used for his 2018 NHL offseason salary projections.
Author: EvolvingWild
The 1st Annual Hockey-Graphs NHL Awards: 2018-2019
It’s that time of year! The ’18-19 NHL regular season ended on Saturday, and that means the time to argue about the NHL player awards has begun. Now of course, the actual awards are voted on by PHWA members, General Managers, and the NHL Broadcasters’ Association for each respective award. However, we (Josh and Luke) decided it would be interesting to see which players the HG writers (and fellow hockey statistics minds) would choose to win the various end-of-season awards. The group of voters is made-up of as many Hockey Graphs writers as we could pester into completing the annoyingly buggy google survey, along with various other writers and hockey people who are in some way associated with the hockey statistics community. Continue reading
Wins Above Replacement: Replacement Level, Decisions, Results, and Final Remarks (Part 3)
In part 1 of this series we covered the history of WAR, discussed our philosophy, and laid out the goals of our WAR model. In part 2 we explained our entire modeling process. In part 3, we’re going to cover the theory of replacement level and the win conversion calculation and discuss decisions we made while constructing the model. Finally, we’ll explore some of the results and cover potential additions/improvements.
Continue readingWins Above Replacement: The Process (Part 2)
In part 1, we covered WAR in hockey and baseball, discussed each field’s prior philosophies, and cemented the goals for our own WAR model. This part will be devoted to the process – how we assign value to players over multiple components to sum to a total value for any given player. We’ll cover the two main modeling aspects and how we adjust for overall team performance. Given our affinity for baseball’s philosophy and the overall influence it’s had on us, let’s first go back to baseball and look at how they do it, briefly.
Continue readingWins Above Replacement: History, Philosophy, and Objectives (Part 1)
Wins Above Replacement (WAR) is a metric created and developed by the sabermetric community in baseball over the last 30 years – there’s even room to date it back as far as 1982 where a system that resembled the method first appeared in Bill James’ Abstract from that year (per Baseball Prospectus and Tom Tango). The four major public models/systems in baseball define WAR as such:
- “Wins Above Replacement (WAR) is an attempt by the sabermetric baseball community to summarize a player’s total contributions to their team in one statistic.” FanGraphs
- “Wins Above Replacement Player [WARP] is Prospectus’ attempt at capturing a players’ total value.” Baseball Prospectus
- ”The idea behind the WAR framework is that we want to know how much better a player is than a player that would typically be available to replace that player.” Baseball-Reference
- “Wins Above Replacement (WAR) … aggregates the contributions of a player in each facet of the game: hitting, pitching, baserunning, and fielding.” openWAR
Penalty Goals: An Expanded Approach to Measuring Penalties in the NHL
Intro
Penalty differential figures are a rather ambiguous concept in hockey. It seems only recently that the majority of analysts and fans have stopped touting a player’s total penalty minutes as a positive aspect of a player’s game. Let’s get one thing clear: taking penalties is a bad thing and drawing penalties is a good thing. When a penalty is taken or drawn, the change in strength state (5v5 to 5v4 for instance) directly impacts the rate of goal scoring for a given player’s team (goals for and goals against). We can measure this change by determining league average scoring rates at each strength state and can then determine the net goals that are lost/gained from a penalty that was taken/drawn. This was first shown in the penalty component of the WAR model from WAR-On-Ice (WOI) here. A.C. Thomas explains it:
Continue readingReviving Regularized Adjusted Plus-Minus for Hockey
Introduction
In this piece we will cover Adjusted Plus-Minus (APM) / Regularized Adjusted Plus-Minus (RAPM) as a method for evaluating skaters in the NHL. Some of you may be familiar with this process – both of these methods were developed for evaluating players in the NBA and have since been modified to do the same for skaters in the NHL. We first need to acknowledge the work of Brian Macdonald. He proposed how the NBA RAPM models could be applied for skater evaluation in hockey in three papers on the subject: paper 1, paper 2, and paper 3. We highly encourage you to read these papers as they were instrumental in our own development of the RAPM method.
While the APM/RAPM method is established in the NBA and to a much lesser extent the NHL, we feel (especially for hockey) revisiting the history, process, and implementation of the RAPM technique is overdue. This method has become the go-to public framework for evaluating a given player’s value within the NBA. There are multiple versions of the framework, which we can collectively call “regression analysis”, but APM was the original method developed. The goal of this type of analysis (APM/RAPM) is to isolate a given player’s contribution while on the ice independent of all factors that we can account for. Put simply, this allows us to better measure the individual performance of a given player in an environment where many factors can impact their raw results. We will start with the history of the technique, move on to a demonstration of how linear regression works for this purpose, and finally cover how we apply this to measuring skater performance in the NHL.
Continue readingRevisiting Relative Shot Metrics – Part 2
In part 1, I described three “pen and paper” methods for evaluating players based on performance relative to their teammates. As I mentioned, there is some confusion around what differentiates the relative to team (Rel Team) and relative to teammate (Rel TM) methods (it also doesn’t help that we’re dealing with two metrics that have the same name save four letters). I thought it would be worthwhile to compare them in various ways. The following comparisons will help us explore how each one works, what each tells us, and how we can use them (or which we should use). Additionally, I’ll attempt to tie it all together as we look into some of the adjustments I covered at the end of part 1.
A quick note: WOWY is a unique approach, which limits it’s comparative potential in this regard. As a result, I won’t be evaluating/comparing the WOWY method further. However, we’ll dive into some WOWYs to explore the Rel TM metric a bit later.
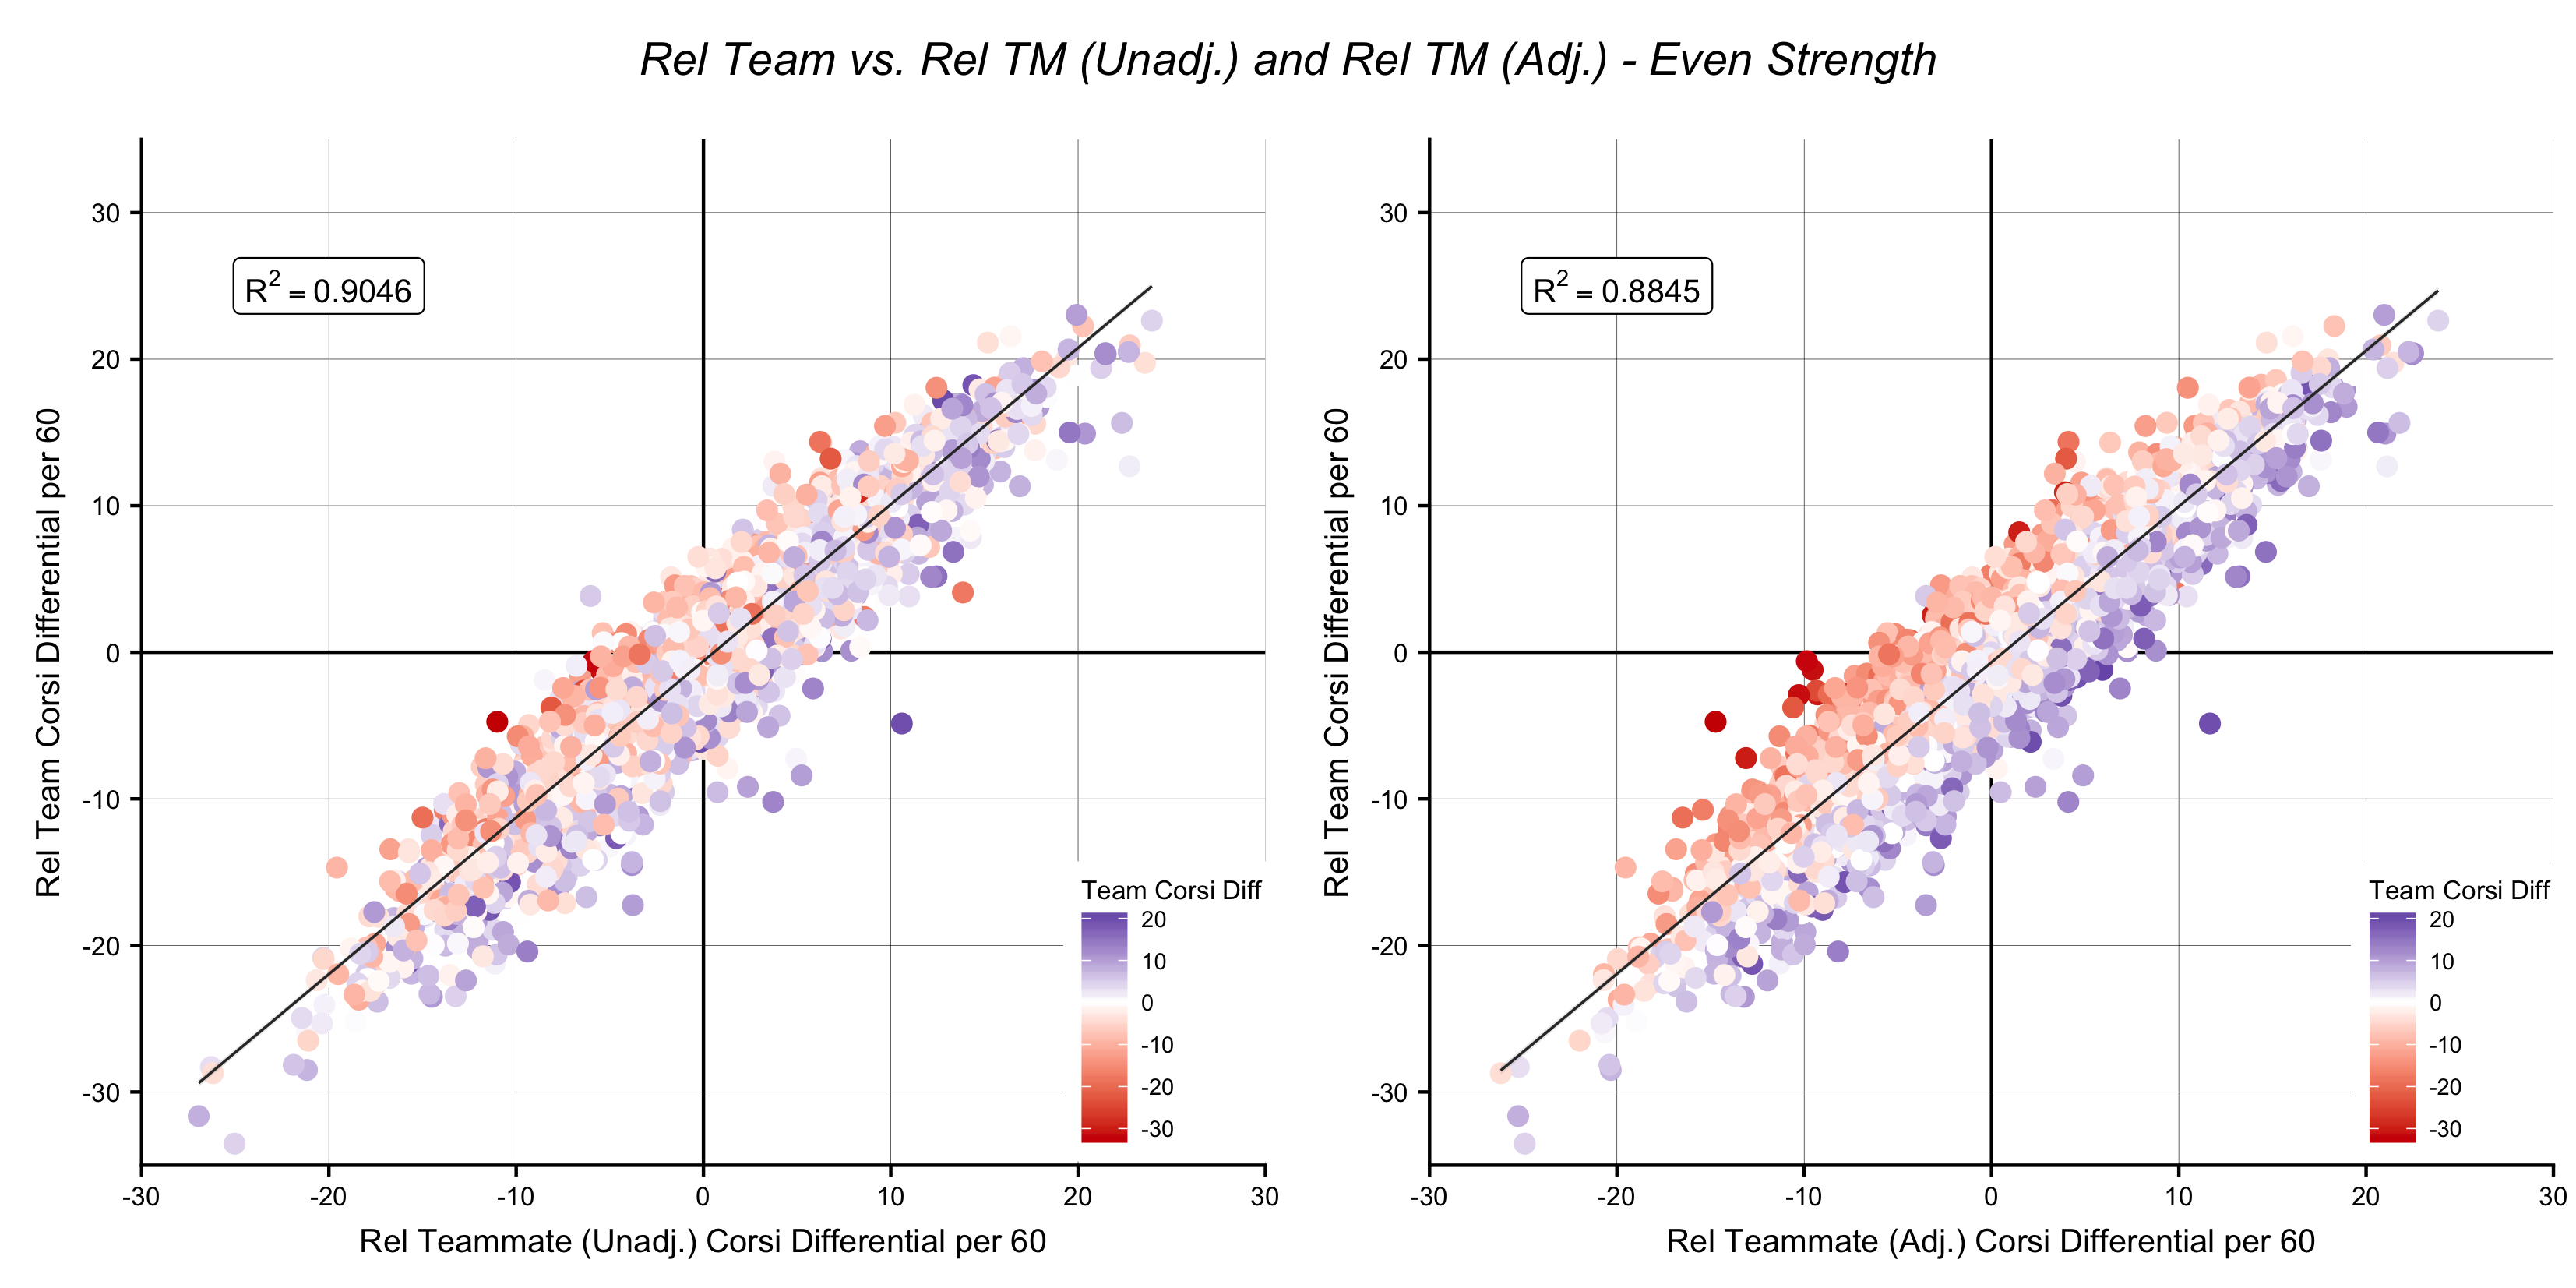
Rel Team vs. Rel TM
Note: For the rest of the article, the “low TOI” adjustment will be included in the Rel TM calculation. Additionally, “unadjusted” and “adjusted” will indicate if the team adjustment is implemented. All data used from here on is from the past ten seasons (’07-08 through ’16-17), is even-strength, and includes only qualified skaters (minimum of 336 minutes for Forwards and 429 minutes for Defensemen per season as estimated by the top 390 F and 210 D per season over this timeframe).
Below, I plotted Rel Team against both the adjusted and unadjusted Rel TM numbers. I have shaded the points based on each skater’s team’s EV Corsi differential in the games that skater played in:
Revisiting Relative Shot Metrics – Part 1
Relative shot metrics have been around for years. I realized this past summer, however, that I didn’t really know what differentiated them, and attempting to implement or use a metric that you don’t fully understand can be problematic. They’ve been available pretty much anywhere you could find hockey numbers forever and have often been regarded as the “best” version of whatever metric they were used for to evaluate skaters (Corsi/Fenwick/Expected Goals). So I took it upon myself to gain a better understanding of what they are and how they work. In part 1, I’ll summarize the various types of relative shot metrics and show how each is calculated. I’ll be focusing on relative to team, WOWY (with or without you), and the relative to teammate methods.
A Brief Summary
All relative shot metrics whether it be WOWY, relative to team (Rel Team), or relative to teammate (Rel TM) are essentially trying to answer the same question: how well did any given player perform relative to that player’s teammates? Let’s briefly discuss the idea behind this question and why it was asked in the first place. Corsi, and its usual form of on-ice Corsi For % (abbreviated CF%) is easily the most recognizable statistic outside of the standard NHL provided boxscore metrics. A player’s on-ice CF% accounts for all shots taken and allowed (Corsi For / (Corsi For + Corsi Against)) when that player was on the ice (if you’re unfamiliar please check out this explainer from JenLC). While this may be useful for some cursory or high-level analysis, it does not account for a player’s team or a player’s teammates.
Introducing Weighted Points Above Replacement – Part 2
In part 1, I laid out the basis for Weighted Points Above Average (wPAA). Now it’s time to change the baseline from average to replacement level. A lot has been written about replacement level, but I’ll try to summarize: replacement level is the performance we would expect to see from a player a team could easily sign or call up to “replace” or fill a vacancy. In theory it is the lowest tier NHL player.
