
Hockey fans and analysts have always appreciated the importance of passing. But until the passing project led by Ryan Stimson, we couldn’t quantify that importance. His work supported by a team of volunteers and other analysts has established that the passing sequence prior to a shot is a significant predictor of the likelihood of the shot becoming a goal. His work also showed that measuring shots and shot assists combined as shot contributions is a better predictor of future performance for both players and teams than shots alone.
Knowing that, the logical next step is to use passing data in analysis whenever possible. Unfortunately, the NHL does not provide passing data so it must be manually tracked by people like Corey Sznajder. Corey’s work is invaluable and I encourage you to support him but he’s only one person.
This article attempts to estimate a player’s quantity of shot assists in a given sample using publicly available data to help fill in gaps where tracked data doesn’t exist.
The only work I know of that tried to estimate shot assists was by Rob Vollman. He created a stat called setup passes based on assists and on-ice shooting percentage. That stat will serve as one of the benchmarks for progress in this analysis.
This post will introduce a linear model that estimates shot assists relatively effectively and show the value of estimated shot contributions as a stat at the player level. All data is 5v5 and unadjusted via either corsica.hockey or the passing project. It includes the top 390 forwards and 210 defenders in TOI for each season.
The in-sample testing will use 2015-2016 data and the out-of-sample testing will use 2016-2017 data. The out-of-sample tests will only use one season because that’s where I have data. When Corsica relaunches its game-by-game stats for skaters, I (or someone else) could and should revisit the out of sample tests using all skater seasons.
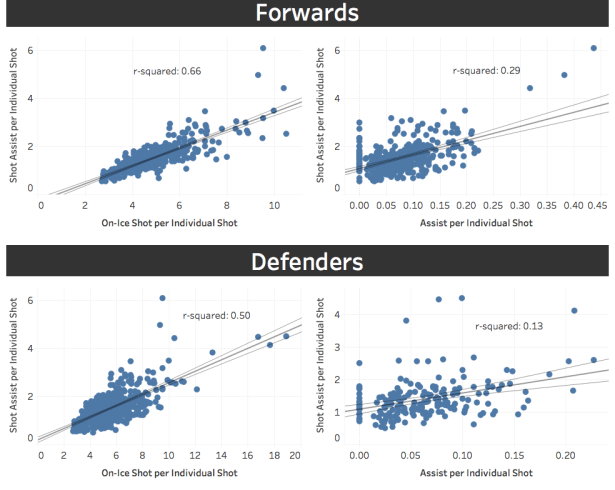
The model is based on two inputs: on-ice shots per individual shot and assists per individual shot. These aren’t stats normally used in hockey analytics. I chose them thinking they would suggest the frequency that a player is passing. If players take very few shots while their teammates take many, that suggests they are passing frequently. And if they tally a high number of assists relative to shots, that also suggests frequent passing.
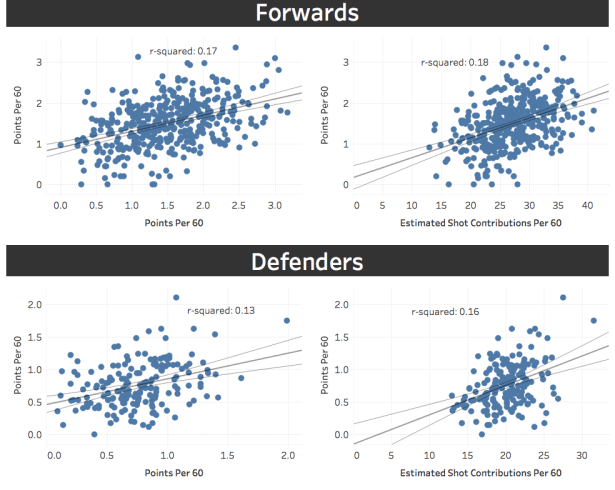
To start, let’s check if these stats do what I’m suggesting. The following scatter plots show the relationship between each stat and shot assists per individual shot for the 2015-16 season. From these four scatter plots, we see an indication of a relationship. On-ice shots per individual shot looks stronger but I see enough to include both in a model attempting to predict shot assists per individual shot.
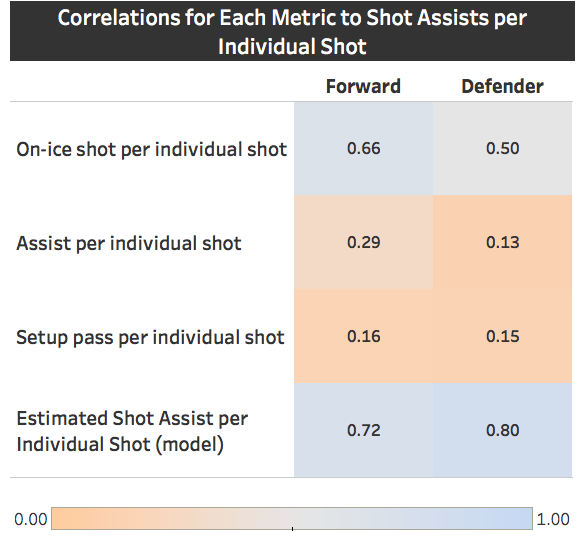
The next step is to create the model and compare its outputs to what we see in the scatter plots. Below are the in-sample correlations for each stat individually as shown in the plots and then combined for forwards and defenders. The model including both stats outperforms either individually and has a relatively strong relationship with shot assists per individual shot. It also shows a notable improvement over Vollman’s setup passes.
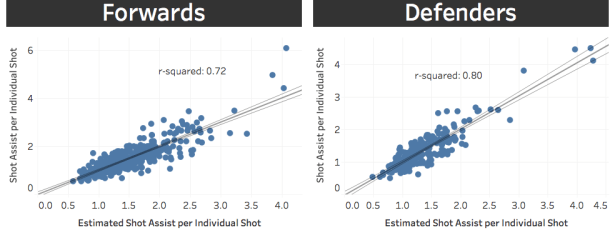
For a visual representation, these are the scatter plots showing the relationship between estimated shot assists per individual shot and actual shot assists per individual shot. The visual matches the values in the table as the relationship appears stronger than in the plots above, particularly for defenders.
At this point, we have our first notable item from this analysis. We can estimate shot assists using publicly available data with reasonable accuracy. That alone is worth doing and was my initial goal. We know passes are important based on the work of Stimson and others so having a reasonable estimate that provides additional context in analyzing player performance is valuable.
The more rigorous test of a new metric is whether it represents an improvement in predicting future results over current metrics. For shot contributions, that test is whether it predicts future scoring better than current points.
To do this, we’ll look at how well a player’s points in the even games of the 2016-2017 seasons predicted their points in the odd games. We’ll then compare that to shot contributions. We’ll do the same for primary points and primary shot contributions. Everything here is treated as a per-sixty-minute rate stat for consistency.
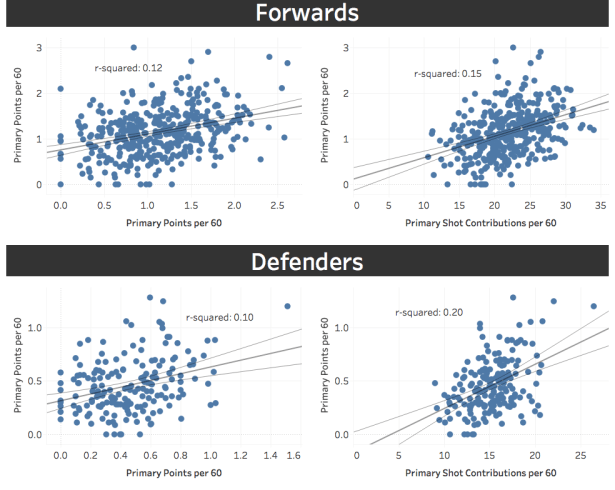
We now have our second notable item from this analysis. Estimated shot contributions and estimated primary shot contributions both outperform their point-based counterparts for forwards and defenders. The gap is more meaningful for defenders, which makes sense because a greater share of their points are likely to be assists.
Based on the results above, we can use the model to estimate 5v5 shot assists for all players going back to 2007-2008 and then create all of the relevant shot contribution metrics. I’ve done that in a Google Sheet. Below is a quick look at the best passing seasons in the data set and the best total shot contributions seasons for both forwards and defenders.
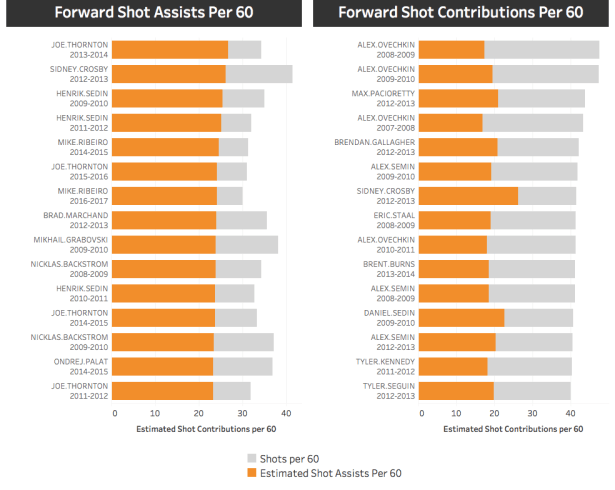
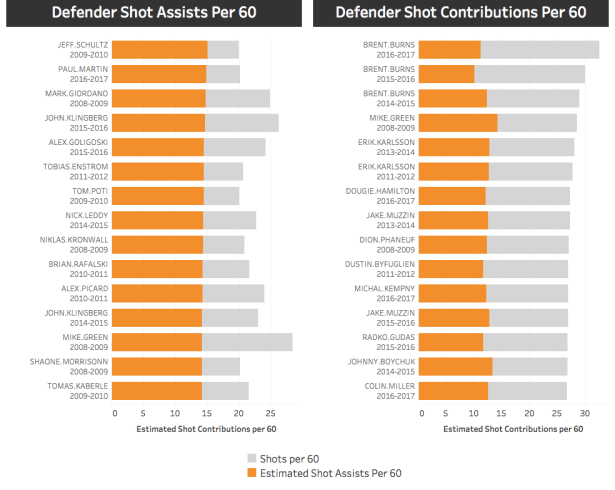
The names are mostly what we would expect for forwards. If we asked hockey fans to name the best passers in the league, Henrik Sedin and Joe Thornton would likely be the most frequent responses. Seeing them at the top of this list adds some smell test credence to the results. The defenders are more surprising, and given that the metric performs better for defenders than forwards, this might signal an interesting area for further exploration.
While this estimate of shot assists does introduce a helpful new metric, it still leaves room for improvement. More sophisticated modeling would likely produce more accurate estimates and improve the predictive value of the metric. More passing data from manual tracking will increase the sample size that can be used to create the model and will also likely lead to improvement. And as stated earlier, the correlations could be revisited on more than one year of data.
Overall, this is a positive step towards a more complete look at a player’s offensive skill set and should open up opportunities to build and improve on the idea of estimating how many shot assists a skater has in a given sample.

Very interesting stuff here.
It appears that 4 of the top shot assist defenseman were Washington Capitals in 2009 or 2010, a result which I’m highly skeptical of – I’d be curious what would happen to some of this data if you left out secondary assists altogether.
I did the same exercise for primaries only, which is also included in the google sheet. And it’s possible the numbers for those players are inflated. The model thinks they were passing frequently because the team put up strong shot numbers with them on the ice but they weren’t the ones shooting.