
Yesterday we looked at the team and skater results from the 2016 – 2018 data that was used to train the xG model. That’s a pretty robust dataset, but it’s unfortunately a bit out of date. People care about this season, and past years are old news. So let’s take a look at the data that Corey Sznajder has tracked for 2018 – 2019 so far.
To be clear, this data is limited. We have 350 games tracked in my latest dataset, a little over the quarter of the season. For some teams, we have as few as 14 games collected. If the results look odd, it could very well be a sample size issue because only a few games were collected. That said, it is enough data to be worth taking a look at. In addition, we can use them “out of sample”. That is, we built the model using data from the past two seasons, and now the model will make predictions on shots it has never seen.
Team Performances
So, with the caveats out of the way, how do the teams look?
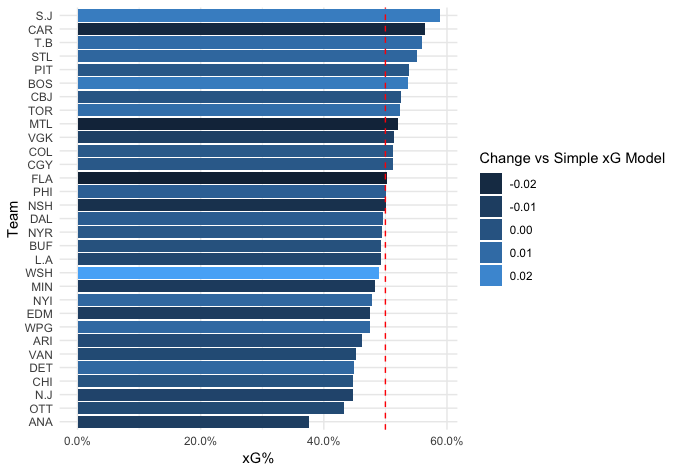
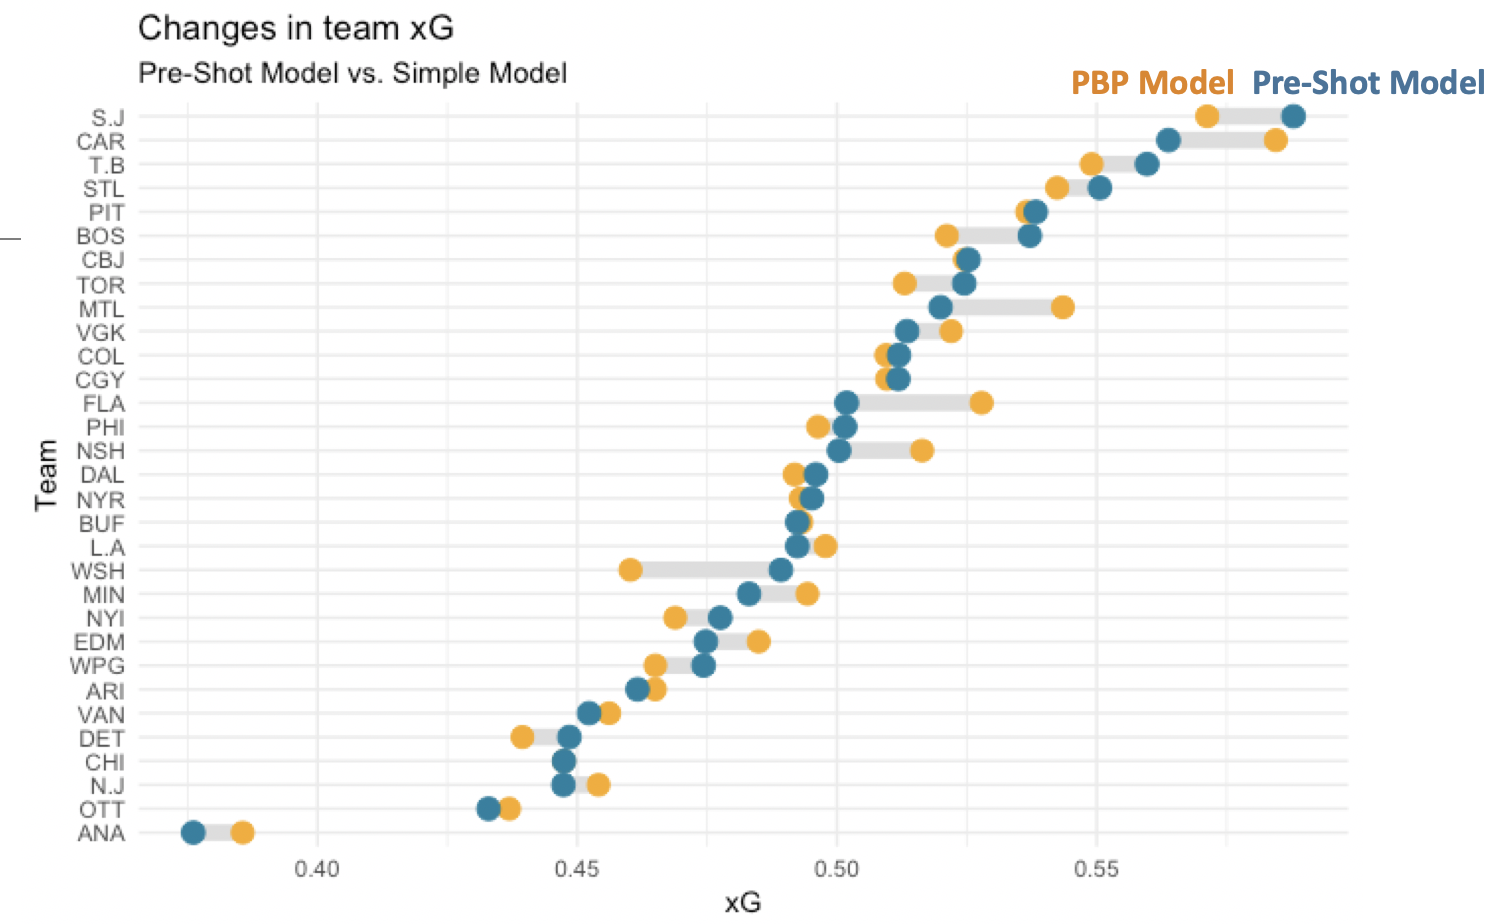
At a glance, these results seem pretty reasonable. The conference finalists are all in the top six along with the historically great Tampa Bay Lightning. The Bottom of the rankings include teams that generally struggled like Anaheim and Ottawa. Like with earlier seasons, we see that the differences between different models are less important than the differences between teams: passing data ultimately provides a valuable but not game changing improvement.
Like we did last time, we can also isolate the average shot quality for and against each team:
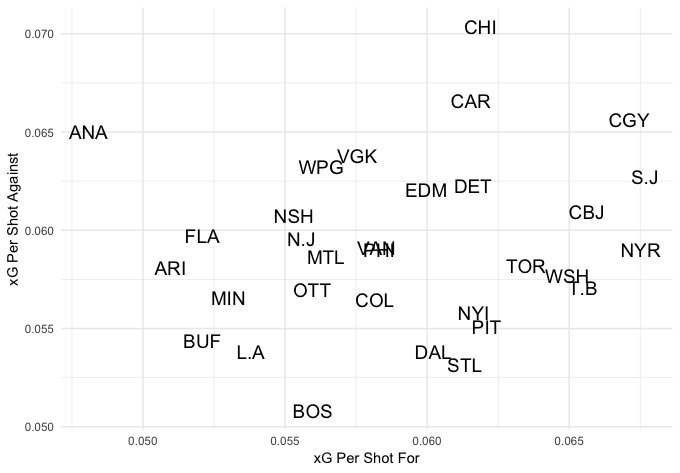
Here we see some interesting results. The Stanley Cup Champion St. Louis Blues were particularly good at getting good quality shots while limiting their opponents, as did the Lightning. The Boston Bruins are a class of their own on defense, giving their opponents the worst scoring opportunities on average. And the Anaheim Ducks were notably bad on both sides of the puck, emphasizing just how crucial John Gibson was to keeping them in games.
Team Playing Style Deep Dives
Let’s dig in to the type of shots that teams took in order to understand their playing styles. In particular, we’ll look at the San Jose Sharks (26 games tracked) and the aforementioned Bruins (20 games tracked). Both teams did very well in xG%, but they create their offense in very different ways:
| BOS | BOS | S.J | S.J | |
| Stat | # / % | Rank | # / % | Rank |
| Passes per Shot | 1.09 | 25 | 1.24 | 5 |
| Offensive Zone Passes per Shot | 0.76 | 25 | 0.92 | 1 |
| % of Shots from Scoring Chance Area | 39.2% | 9 | 39.3% | 8 |
| % of Shots with Royal Road Passes | 6.7% | 1 | 3.1% | 24 |
| % of Shots off Oddman Rush | 3.8% | 20 | 4.4% | 10 |
| % of Shots with Screens | 3.2% | 30 | 8.5% | 1 |
| % of Shots with Pass from Behind Net | 6.7% | 21 | 3.1% | 3 |
| % of Shots with Stretch Passes | 1.0% | 30 | 2.7% | 10 |
| % of Shots with Low-High Pass | 14.8% | 18 | 18.3% | 3 |
From what we can see here, the Sharks succeed through their cycle in the offensive zone: they pass the puck a ton, especially in the offensive zone. Those passes are often down low, as they are near the top of the league in passes from behind the net and low-to-high passes. The former category likely gets to dangerous areas, as they’re 8th in the league in scoring chance shots. The latter engages their defensemen and get a ton of shots with screens. This comes very close to a style of play regularly advocated for by Ryan Stimson, who has shown its tremendous value.
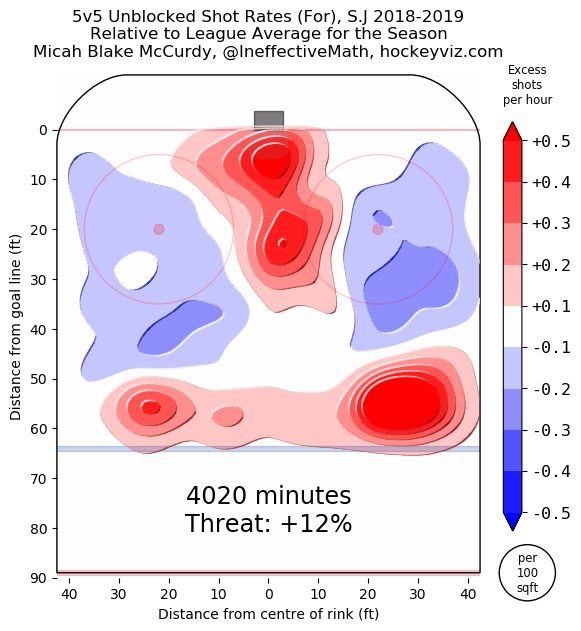
This data is validated if we look at the HockeyViz graph showing where the Shark’s shoot the puck from. There are two clear areas of focus: scoring chances from right in front of the net and (probably screened) shots from the point
We can also look at some video examples to further illustrate this style. Granted, this video analysis is post-hoc: I knew what the data said was common for the Sharks and went looking for an illustrative goal to cherry pick. But it still gives a clearer picture of what this kind of offense can look like. Here’s a classic Joe Thornton setup that clearly demonstrates the value of multiple passes and attacking from behind the net:
And here is what it looks like when they move the puck low-to-high to generate screened shots from their offensive defensemen. This strategy probably works less often but does sometimes connect, especially for a team that uses it as much as the Sharks (thanks to Shayna Goldman for pulling the video):
In contrast, Boston generates good opportunities through pass quality rather than pass quantity. They’re near the bottom of the league in the average number of passes before a shot, but they’re the league leader in royal road passes. These plays are some of the most dangerous scoring opportunities in hockey, which allows them to generate offense without using many of the other tracked techniques. They maintain puck possession and watch for killer opportunities:
Right now, there’s no analysis to suggest that one strategy is better than the other. Both are producing positive results, they just prioritize different techniques. By understanding how these teams differ, we can learn the different options available to teams and better prepare for particular opponents.
Player Performances
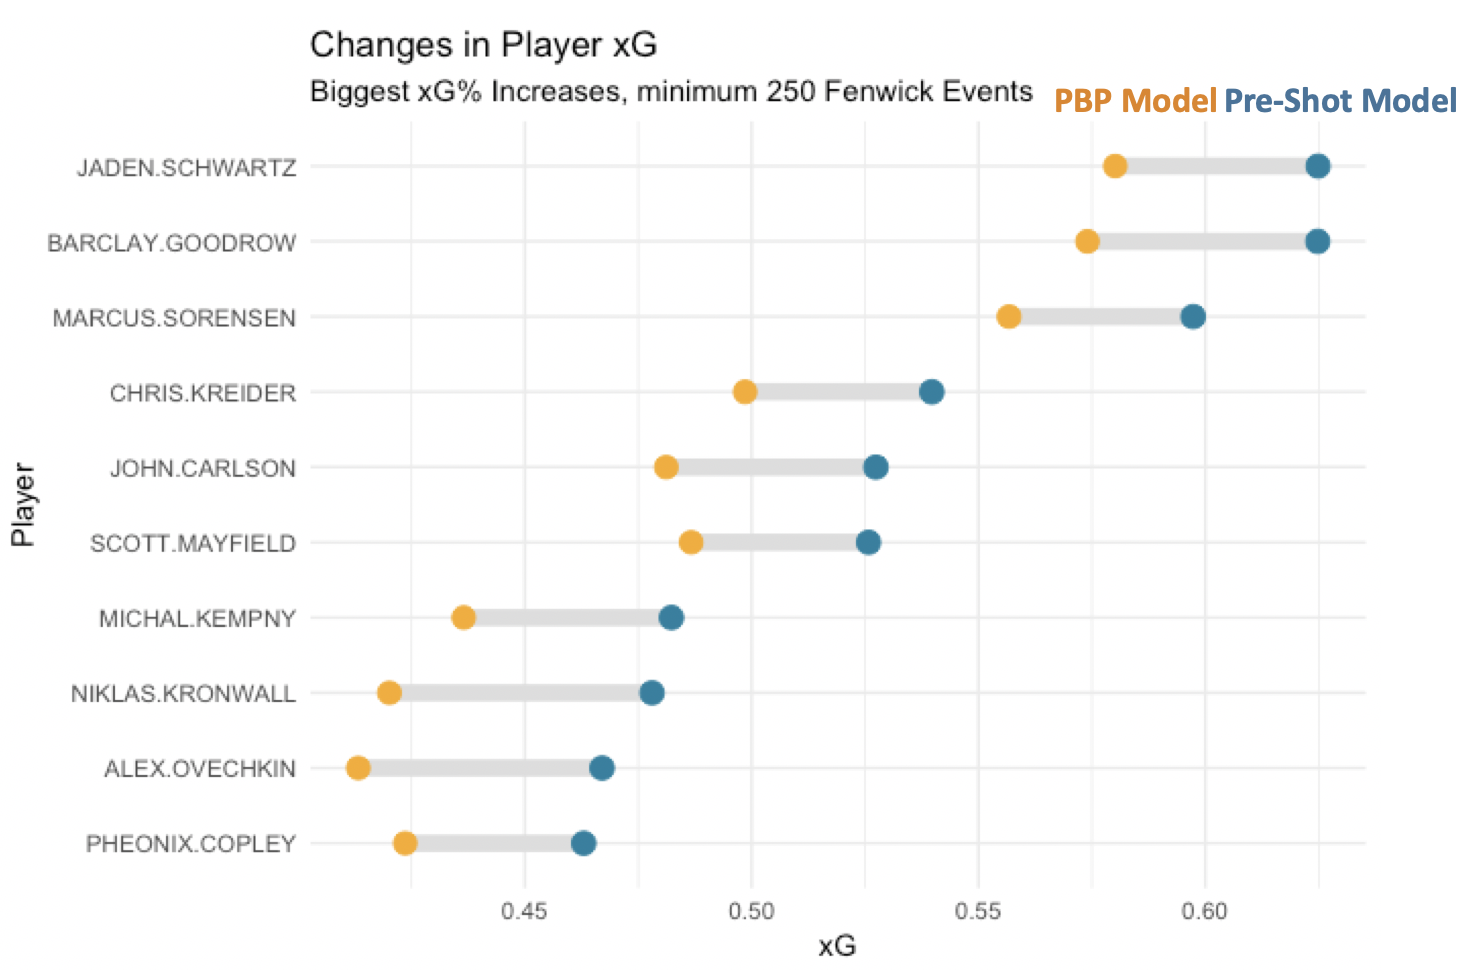
Next, we can look at player performances. Again, I’d advise caution into relying on these too heavily given the small sample size. I’ve lowered the minimum down to being on the ice for 250 unblocked shots, which is not a lot of playing time at all. You can find the full statistics for every player here. Below, we can see the players who had the biggest changes in their on-ice performance when passes are included. This may just be a quirk of a few games, but may be indicative of players whose contributions are misjudged by typical play-by-play analysis.

Goalie Performances
Finally, we can look at goalies. In some cases we are looking at just 250 shots, yet the differences between the best and worst performances are just a couple of dozen goals in a hypothetical sample quadruple that size. Goaltenders are simply too similar to really detect differences in talent over just a few games.
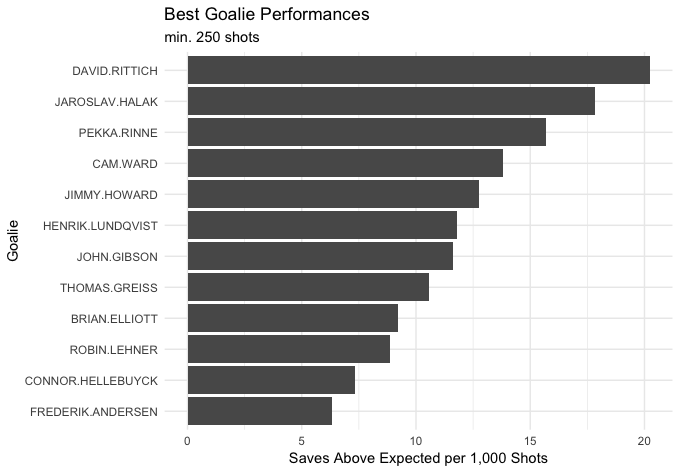
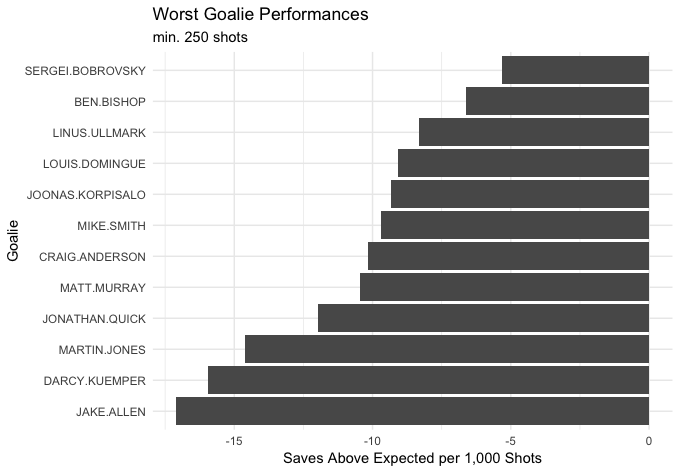
Still, a first pass at the numbers seems promising. They correctly identify a lot of goalies who had particularly strong years, including David Rittich, John Gibson, and both Islander goalies. The xG model also notes Jake Allen’s particularly horrendous start to the year. However, a few here seem like misses, particularly Ben Bishop’s poor marks considering his very strong season. This may be something the model has missed, or may be something that would be fixed if his entire season was included in the data.
Part 1: Introducing the Model
Part 2: Historic Results and WSH Deep Dive
Part 4: Feature Interpretation
