
Most of my posts so far have talked about zone exits from the perspective of the team trying to breakout out of their defensive zone. Now, let’s flip the script and discuss the team on the forecheck. This team does not have possession of the puck, but they are in their offensive zone, which is an advantage. So, how can they regain control?
Zone Exit Metrics by Team
To begin, let’s see how well each team does. There’s a number of different ways we could do this. Ryan Stimson already did this work and focused on preventing a controlled zone exit because it was the most predictive of future goal scoring. In addition, we could look at how often each team prevents any exit at all, prevents a subsequent zone entry, or some combination. For reasons I’ve discussed previously, I first prefer to look at how often the team without the puck prevents the breakout team from entering the offensive zone, which I’ll call “Transition Prevention”. Let’s see how well each team does in our sample (roughly a quarter of the 2018-2019 season and half of the two prior seasons):
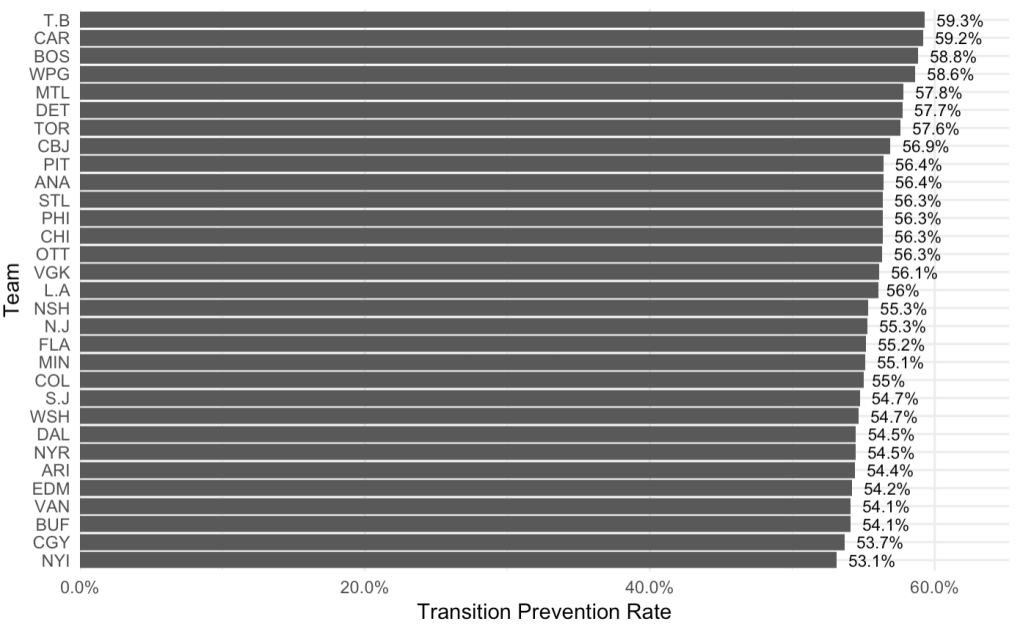
Of course, the zone exit by itself if still of interest to us, so let’s break down the Transition Prevention into two discrete pieces. First, we’ll see how often the team forces a turnover or icing in their offensive zone and prevents a zone exit entirely; we’ll call this a Forecheck Recovery. Second, we’ll look at the breakouts where the zone exit does occur – controlled or not – and see how often the forechecking team stops the play in the neutral zone before their opponent can get a zone entry. We’ll call this a Zone Entry Prevention:
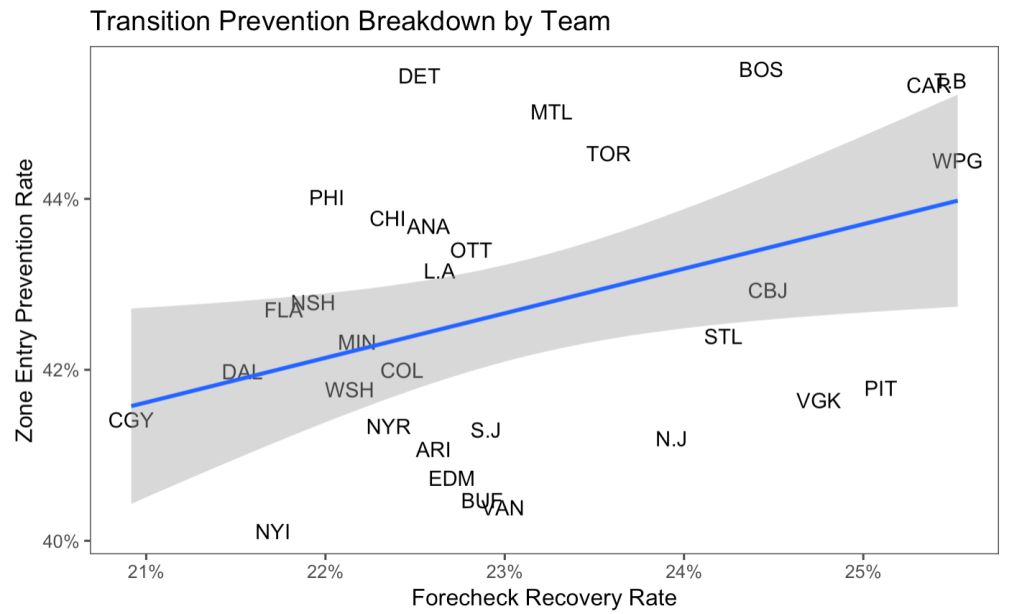
Here we can see how well teams recover the puck in both their offensive and neutral zones. For example, Pittsburgh is one of the best teams in the league at establishing a forecheck that prevents their opponents from exiting their zone. But, once the puck reaches the neutral zone, they are below average at stopping the rush up the ice.
It’s worth noting that there seems to be a positive relationship between performance in each zone. It’s not obviously statistically significant, but they are correlated with an R-squared value of 0.4. It seems that teams that are good at recovering the puck and stopping a breakout tend to be good at it in both zones.
This is meaningful because it might not have been the case. We can imagine a world in which teams are good at Forecheck Recovery because they are super aggressive in the offensive zone; if the breakout team gets past them there, the neutral zone is left wide open and their Zone Entry Prevention suffers. But that world is not our world. Strong performance in one zone does not come at the expense of another.
The Effect of Pressure
Some teams are good at forechecks and some are bad. Big surprise. If this analysis is to be helpful, it needs to help understand why some teams are more effective at recovering the puck than others.
This is a big question and one we cannot entirely answer, especially without detailed and cleaned tracking data. But we can use the information that Corey Sznajder has collected to take a first pass. In particular, there’s one feature that seems to be a crucial predictor of success: pressuring the player attempting the breakout.
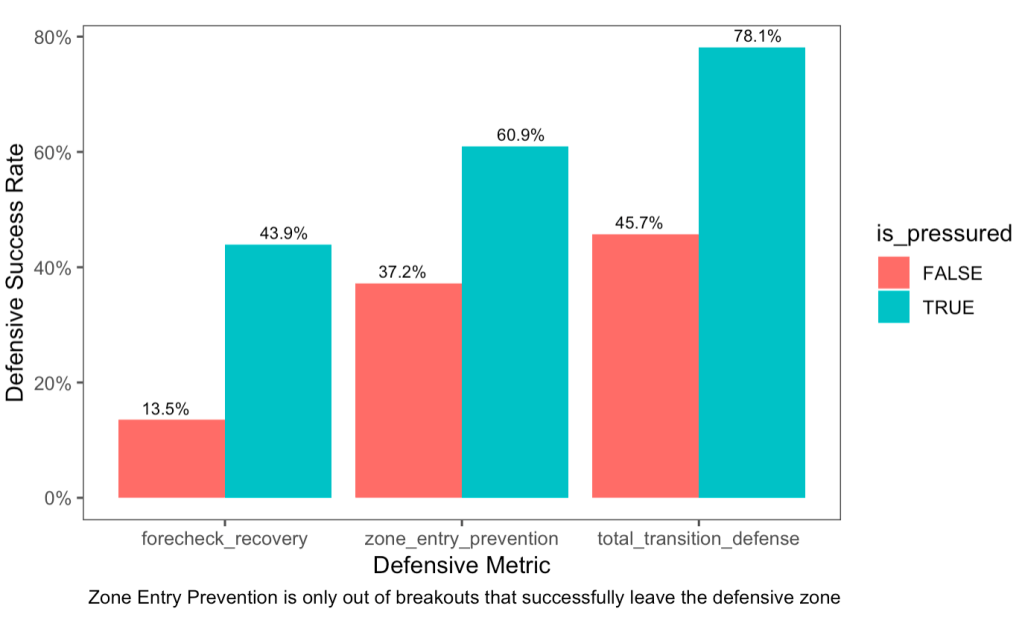
This is a crucial finding: Forechecking teams prevent a zone entry 78% of the time if they pressure the puck carrier at the time of the zone exit, but just 46% of the time if they do not.
Here, we’re defining pressure as being within a stride of the puck carrier and moving towards them. There’s some subjectivity here, so it’s not perfect. In particular, there’s a chance that the end result of the play creates unconscious bias about whether the skater was pressured, such as soccer analysts saw in their “big chance” feature. But having all the data collected by one person limits the bias, so we’ll treat it as reasonably reliable.
The success comes in both stages of the play: pressuring forechecks are more likely to prevent a zone exit for occurring at all, and they are more likely to stop their opponents in the neutral zone. This latter finding is not obvious: why should pressuring an opponent in the defensive zone lead to success in the neutral zone? The answer becomes clear if we look at what types of zone exits happen with and without pressure:
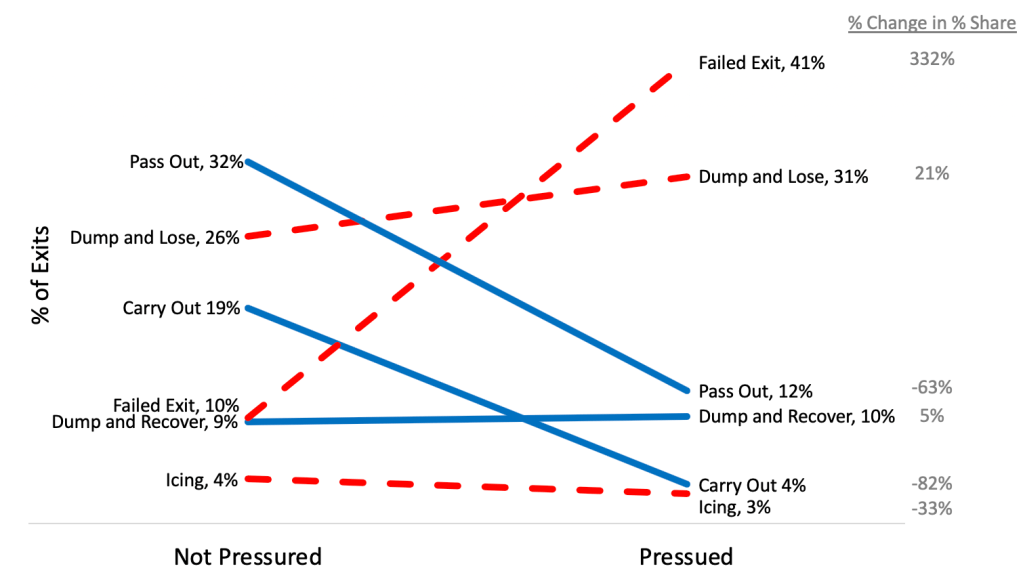
Pressuring the player making a zone exit forces him to make a worse zone exit. The player breaking out manages to carry the puck out with possession just 4% of the time, vs. 19% when they do not face pressure. Pass outs have a drop that’s almost as precarious. In their place are turnovers: either a failure to exit the defensive zone at all, or a dump out that the forechecking team can easily recover in the neutral zone.
The key effects of pressure on a forecheck are forcing turnovers and encouraging bad exit types. We know this because pressure does not have much of an effect on the success rate of any particular exit type:

Pass outs are equally successful whether or not the puck carrier is pressured. Carry outs and dump outs take a slight hit, but not nearly enough to explain the effects of pressure. Pressure works by forcing opponents into worse types of zone exits and forcing failures in the defensive zone.
Forecheck Pressure by Team
Let’s connect the last two sections. Not only does pressure generally lead to better results on the forecheck, but the teams that pressure more often also tend to have more success:
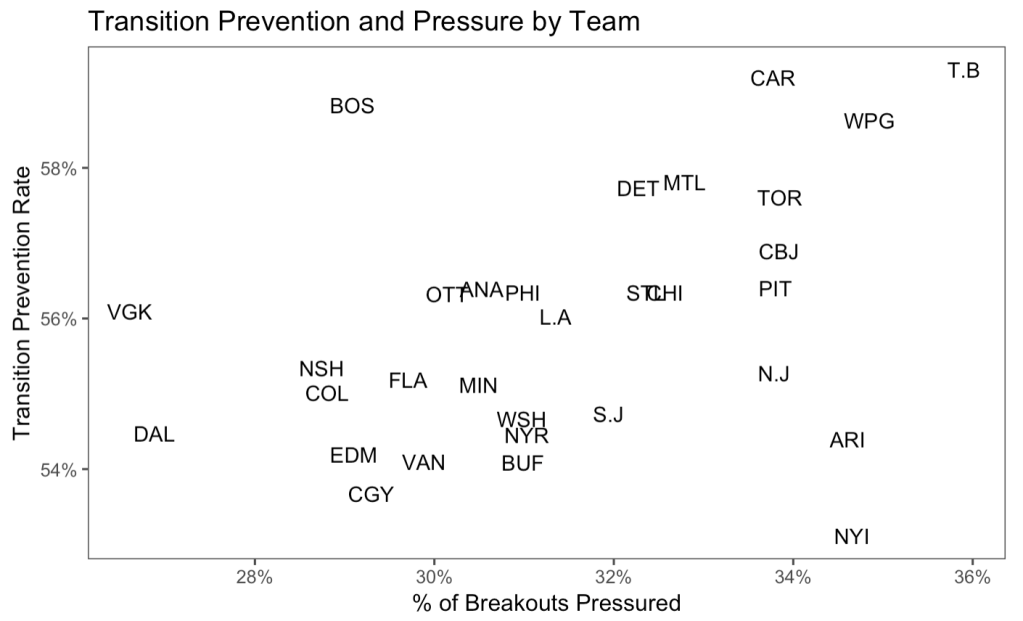
Tampa Bay, Winnipeg, and Carolina are all some of the most aggressive teams and also the best at preventing transitions. Of course, this relationship is not exact: the correlation is 0.46, which leaves plenty of room for exceptions. For example, the Islanders and Coyotes regularly pressure their opponents but are not able to turn that into possession. In contrast, the Boston Bruins use pressure less than most teams but are very effective on the forecheck nevertheless. Their success would be worth a deeper tactical dive, but for now, we’ll attribute it to Patrice Bergeron Magic.
In sum, most teams would be better served by pressuring the puck carrier more often. It’s possible that this strategy comes with tradeoffs: perhaps pressure in the offensive zone leave the team vulnerable if they end up in their defensive zone. While more study of this would be valuable, I suspect that this tradeoff is minor. Pressure in the offensive zone is correlated with success in the neutral zone, which indicates that it does not leave the defenders totally out to lunch.
That said, there are more nuanced ways to think about forecheck pressure than the single data point we currently collect. In the future, we could do much more around the number of players as well as their speed and position, among other things. In addition, Stimson has illustrated how a team can have success on the forecheck because their pressure is applied indirectly through additional layers in the neutral zone. This may be what is happening with the Bruins. Ideally, these findings should lead to collaboration with tactical experts who can translate them into more direct coaching suggestions.
Breakout Responses to Pressure
Finally, let’s flip back to the breakout team just briefly. Now that we know that pressure has a big effect on breakouts, it’s natural to ask how each team handles it. Here is the percentage of each team’s exit attempts that lead to zone entries, split by whether or not they were pressured:
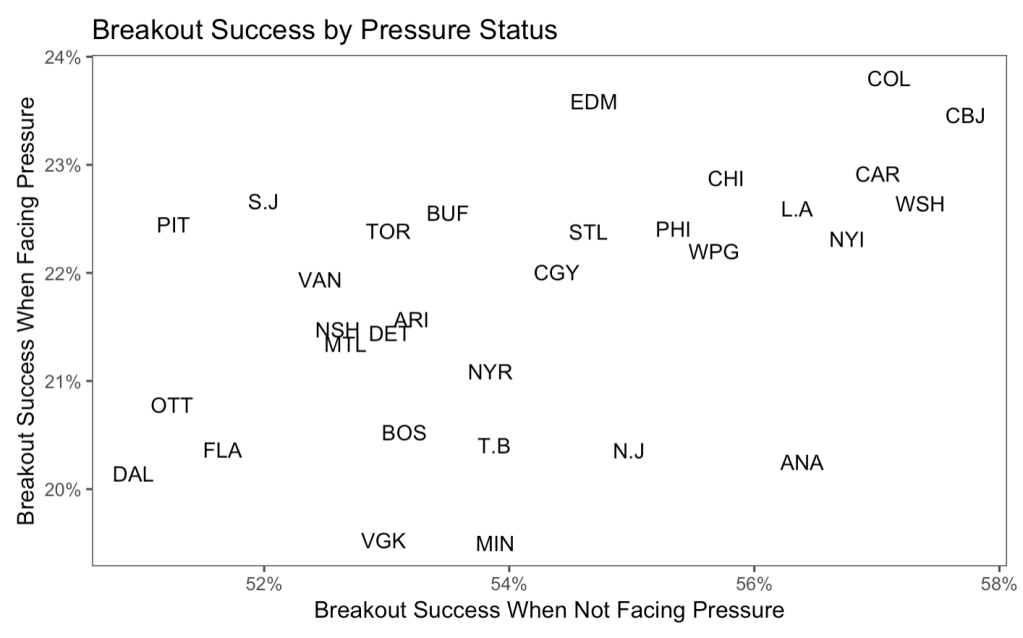
A quick look at the axes will confirm that every team does much better when they do not face pressure on their zone exits. Furthermore, there is a correlation of 0.49 between the two rates, so success with and without pressure are typically related.
That said, there is some variation. In particular, Anaheim does notably worse when facing pressure than we would expect based on their otherwise strong ability to transition the puck without pressure. New Jersey, Minnesota, and Las Vegas have similar issues. In contrast, Edmonton, San Jose, and Pittsburgh handle pressure better than we would expect given their pedestrian performance without it.
To close, I don’t have many video examples of beloved forecheck pressures. But, if you’ll allow me to leave the NHL and 5v5 play, I can share a celebrated penalty kill that succeeded through pressure in the offensive zone:

Very interesting article. Question – you say Transition Prevention is how often the forechecking team allows the other team to enter their zone following a forecheck. But that it does not have to do with how often they allow the other team to break out of their own zone vs. that forecheck.
But the breakout comes first, right? Mustn’t any zone entry allowed by a forechecking team have come immediately following a breakout vs. that forecheck?
Let’s say FLA is forechecking vs MTL. So FLA sends pressure into MTL’s zone as MTL retrieves the puck and looks to break out. MTL does break out, skates through the NZ and enters FLA’s zone. That makes sense to dock FLA’s forecheck there.
But let’s say MTL fails to breakout of their own zone. They flip the puck out and FLA gets it in the NZ before turning it over back to MTL who then enters FLA’s zone.
Depending on what occurs between MTL’s breakout and MTL’s zone entry, is it fair to attribute all MTL’s zone entries to FLA’s forecheck? Was there a time limit or guidelines re: possession of what occurs between MTL’s breakout and their zone entry?
Perhaps if there’s a discrepancy – a teams that is good at preventing breakouts after they forecheck, but bad at preventing zone entries – wouldn’t that speak more towards their neutral zone play, rather than their forecheck?
That’s a fair comment and probably comes in part from me being a bit sloppy in my terminology.
I see Transition Prevention as a two-part process: Forechecking in the offensive zone and Zone Entry Prevention in the neutral zone. Forechecking happens every time the other team tries a zone exit. Zone Entry Prevention happens either after a zone exit (so when the initial forecheck piece fails) or when the opposition recovers the puck in the neutral zone.
My data is all based on zone exits, so it will miss out on those latter opportunities. In your second hypothetical, my data would count the first rush as a failure for their Forecheck because MTL did get the puck out of their zone, but a success for their zone entry prevention and subsequently an overall success for their Transition Prevention. They messed up by turning it back over and allowing a zone entry, but my current data wouldn’t capture that. I can’t prove it, but I suspect that those zone entries I’m missing here are not materially different from the ones I do have (i.e. the ones that begin in the other team’s defensive zone rather than the neutral zone). We have a separate dataset focusing purely on zone exits, so this could be checked more rigorously.
There absolutely could be a team that’s good on the forecheck but bad at preventing zone entries. In fact, the second chart indicates that PIT, VGK, and N.J all fit that pattern to some extent. I see the two skills as related but not identical, so I like to look at both the total success rate of the whole process and how it breaks down into the two pieces.
I’m not totally confident I answered your questions but I hope that that helps