How much is the “best fourth line in hockey” worth?

The New York Islanders agreed to terms Casey Cizikas to a five-year contract extension worth $3.35 million on average per year.

This extension sent shock waves throughout Twitter, Reddit, and discussion boards as it seemed to be a hefty price and term to pay for a member of the team’s fourth line. The Islanders were not without their defenders, though, with many pointing out the “best fourth line” label the trio of Casey Cizikas, Matt Martin, and Cal Clutterbuck are often given.

Prior to debating whether or not the Islander trio is actually the best fourth line ever (or even currently) in hockey, we should ask: How much is the best fourth line in hockey worth?

Continue reading

Genie Bouchard, Expectations & What Players Need To Understand About Stats

Embed from Getty Images

This post is not really about Genie Bouchard, or even tennis in general, but let’s start with her.

On Thursday, Bouchard, the top-ranked Canadian player on the WTA Tour, lost 6-4, 6-4 to No. 8 seed Timea Bacsinszky at Roland Garros. The loss could be interpreted as another setback for Bouchard, who ranked as high as No. 5 in the world in October 2014. Since then, she has slumped, going 12-18 in 2015 after winning 39 and 43 matches in the previous two years. What’s gone wrong?

Possibly, the answer is nothing at all.

Continue reading

Practical Concerns: On Randomness, Risk-Taking And Coaching

Screenshot_2016-05-16-13-09-59

Something I set time aside for during the off-season is reading non-hockey books in an attempt to gain a better perspective on hockey. The work of Michael Lewis (Liar’s Poker, The Big Short, Boomrang) and Nassim Taleb (The Black Swan, Fooled By Randomness) were of particular inspiration.

Below are some assorted thoughts based on recent readings and events. Tweet me (@ML_Han) if you’d like to disagree and tell me why. Eventually I hope to spend some time talking about this or a tangential at the second edition of RITHAC this September.

Continue reading

Book Review: Caveman Logic & “The Only Rule Is It Has To Work”

book

In my experience, using analytics to influence coaching decisions is a profoundly weird and incredibly interesting exercise, which is why I was very excited to read a book called The Only Rule Is It Has To Work, a newly released book written by Ben Lindbergh and Sam Miller, two Sabermetricians who took over a pro baseball team for a season.

Being a fast reader, I blasted through the pages in about two days. I’m happy to say that got a lot out of this book. If you’re here, you probably would too.

While I don’t know or care much about baseball, Ben and Sam are my kindred spirits. There are not many people who have had the opportunity to use analytics to directly impact how a sports team is run on a day-to-day basis. As I found myself leafing through the pages, I saw a lot of my own hockey experiences in the authors’ words.

Whether it was gaining the trust of the coaching staff, overcoming teething IT issues, or occasionally falling prey to heuristics and losing “objectivity,” I identified a great deal with Ben and Sam’s trials and tribulations. So much so, that I began tweeting at Ben before I even finished the book.

Continue reading

Practical Concerns: “The Blind Side”, Intangibles and My Off-Season Plan At McGill

mmm.jpg

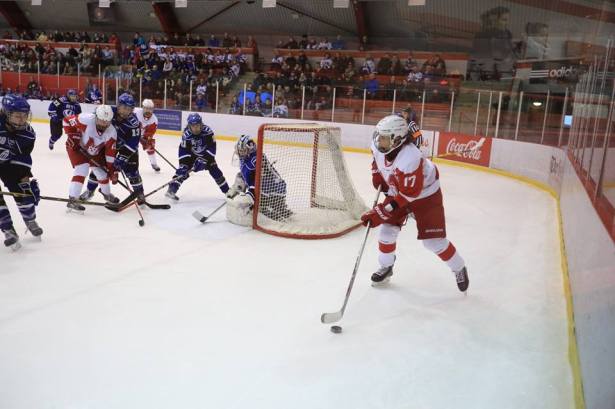
(Photo credit: Derek Drummond)

At VANHAC, I was asked by a few people about how we use analytics in our program. Every season is different, and to gain a full appreciation of my intentions this summer, it’s worth digging into the central thesis of a football book.

What Really Drives Results?

“[Quarterback Joe Montana, wide receiver Jerry Rice and running back Roger Craig] are stars. They accumulated the important statistics: yards, touchdowns, receptions, completions. [Left tackle Steve] Wallace is not considered a producer. He has no statistics.” – The Blind Side: Evolution of a Game (Michael Lewis, 2006)

While Michael Lewis’ Moneyball did much to improve the popular understanding of analytics in sports, I happen to think that The Blind Side can help bridge the gap between traditionalist and numbers-driven analysts just as much as Moneyball did.

If you peel away the diverse storylines in The Blind Side, this is the central question behind Lewis’ book: What does a good left tackle do for his quarter-back (and by extension, their team)? And how much is that worth?

Very valuable, as it turned out. Unless an NFL team wanted your multi-million dollar quarterback seriously maimed by an opposing pass-rusher, it had better hire a left tackle with the size, speed and sense to keep up. The problem is, if this player does his job well, nothing happens that can directly be attributed to him – he has no statistics.

But conceptually, his impact on the game is not all that hard to identify. A good left tackle provides a safe, productive (and dare I say, fun) work environment for his teammates. By paying attention to the process of football, you can probably come up with a few good ways to account for that.

mmm2.jpg

(credit: Derek Drummond)

Building A Bridge

When you arrive to this conclusion about football players, it becomes a lot easier to see why the idea of “being a good teammate” and “having intangibles” matters to people working in hockey. I’ve alluded to this elsewhere, but there are really two aspects to creating that good working environment for other people – one can’t be expressed in numbers conveniently, but I reckon the other already can be. Both matter a great deal to the end result, and to how people feel in the process to getting there.

I didn’t have time to really dig into this during my talk at VANHAC, but this is probably the most important realization I’ve had in two years working for the McGill Martlets hockey program.

Continue reading

How Can We Quantify Power Play Performance In Formation?

Screen Shot 2016-02-26 at 4.55.31 PM

Last week I wrote about a new metric, ZEFR Rate, which measures zone entry success on the power play and is relatively repeatable and predictive of future goal scoring efficiency. The metric was based around the idea that getting into formation efficiently — most frequently a 1-3-1 — is a catalyst for power play success.

But now let’s say you’re a team that has perfected your entry scheme, and you find yourself setting up in formation at a consistent rate. What now? How can one maximize one’s use of possession in formation to score goals at the highest possible rate?

Continue reading

ZEFR Rate: A New and Better Way to Evaluate Power Plays

Screen Shot 2016-04-17 at 4.49.36 PM

Some day we will reach the point where we can comprehensively analyze which power plays are the best, which players drive that success, and most elusively, what roles to place players in to maximize a unit’s output, but statistically, our special teams cupboard is pretty bare. This season, as many of you know, I took on the long and arduous task of hockey tracking in the interest of trying to get us even one step closer to our objective: how can we better evaluate and predict power play success? So let’s dive right in. Continue reading

The Shift: Breaking Down The L.A. Kings’ Secrets To Success

k8

By virtue of their 5vs5 shot differential, the Los Angeles Kings are the best team in hockey. As of Saturday night, the Kings are rolling along at 56.1% Corsi – #1 in the NHL by a long shot. In fact, the 3% gap between the Kings and the No. 2 Anaheim Ducks is the same as the one between the Ducks and the No. 15 Philadelphia Flyers.

So why are the King so good?

The simple answer is that they have good players executing a sound game plan developed by a good coaching staff. But how exactly does this manifest itself?

On March 26th, the Kings were beating up on the Edmonton Oilers in the middle of the second period when, in the span of 45 seconds, they put together – in my mind – a perfect, representative shift of everything that makes them a superior hockey team.

Continue reading

A New Passing Project Data Visualization

Image

Back when the season started, I started playing around with the idea of how best to visualize our passing data. There will be plenty of time to arrange it in a viz to evaluate players like we did last season (Forwards, Defensemen), but there’s another way to present this data and that is within the realm of tactics and opposition analysis. Last December, I wrote a little preview of what we can do with this data by focusing on tendencies of how and where teams generate offense. If you haven’t yet, I encourage to read these pieces (all are linked in the beginning of that piece I just linked) for the background of what I’ve been imagining for this data since I added in lane concepts last summer.

We already know that passing is a skill and an important one at that, so there is always the importance for the descriptive and predictive levels of analytics (what has happened, what will happen), but one we don’t often discuss is the prescriptive level (what should we do). Combining data visualization of these events and video analysis is the best way forward. In this post, I’ll go over exactly how to use our new viz to pinpoint areas of the game to analyze. If you simply want to go to the viz, scroll to the bottom of this piece.

Continue reading

Shot quality and save percentage revisited, again…

Embed from Getty Images

Listen; I get it. Some people are sick and tired of this supposed debate that’s been ongoing for over ten years now. But what really is the actual debate all about? What is it we are arguing on Twitter over? What should we be aware of?

Continue reading