
This week, I’ve introduced some of our latest and newest data and metrics. On Monday, I posted a refresher on what passing metrics were and why they were important. Tuesday had network and linkup data that really only scratches the surface on what we can do this season. Yesterday, I introduced lane Corsi concepts and how they might reveal a bit more information when examining how teams generate offense and defend against the opposition. Today’s post is rather ambitious in that I will take all the different ways of using this data, synthesize it into an advance analysis of the opposition, and then provide the data of the game in question to see how things matched up.
We’ve had a Toronto focus all week, so that will continue. The opposition will be the New Jersey Devils and we’ll focus on their clash from December 8th. This will be done under the hypothetical assumption Toronto’s opposition analysts have access to this type of information league-wide and how they could make use of it. All data is 5v5 unless otherwise stated. Leafs data is from 13 of their first 26 games in aggregate; Devils data is from their first 21 games.
The Opposition Data
So, in preparation of the upcoming contest against the Devils, we would need to pull their data and identify who the key contributors are, how they generate offense, and how this matches up with our team (the Leafs).
In looking at the Devils individual contribution rates, we see the Leafs caught a break with Travis Zajac out of the lineup. Zajac gets a lot of flack due to his contract, but his passing and setup ability is severely underrated.
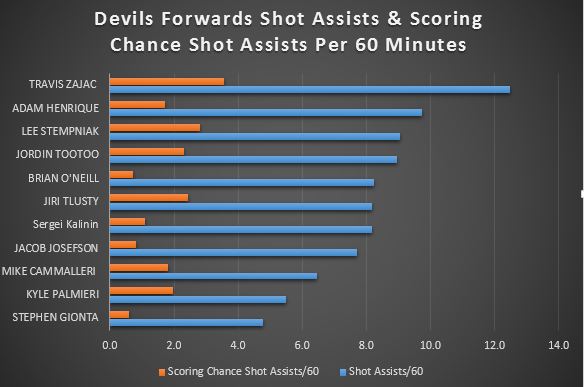
With Zajac out of the lineup, the Devils did not have one of their most effective setup men to generate offense. This has a negative effect throughout the rest of the line up as Kyle Palmieri, a regular line mate of Zajac’s, typically attempts seven attempts from passes per sixty minutes. In this game, he managed a single shot attempt.
The chart above also indicates playing styles as Mike Cammalleri and Palmieri are near the bottom of shot generation. They are skilled shooters and are typically the beneficiary of the passing abilities of a Zajac, but it further hammers home the point that the shooters will struggle more to impact the game if they cannot be set up with chances.
But enough about Zajac and the Devils lack of forward depth. Let’s move to the Devils Passing Lane Corsi: where are they strong? Where can they be exposed?
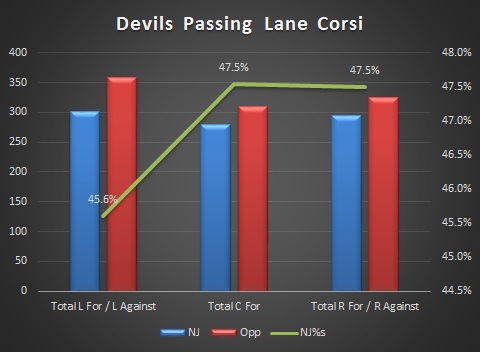
The Devils’ opposition complete more passes and have more shot assists all over the ice. They are primarily susceptible down the left. So, which defensemen and forwards should the Leafs target down that side to maximize an apparent weakness?
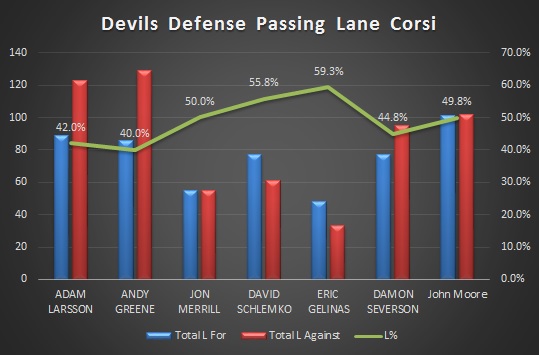
Surprisingly, it’s the Devils top pairing of Adam Larsson and Andy Greene that are most exposed down the left side. Severson and John Moore also are not great. And the forwards?
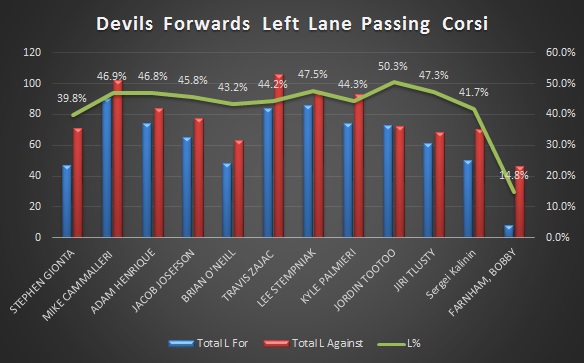
Normally, we’d see wide swings across the forwards than the defensmen, and we some more valleys than peaks (seriously Bobby Farnham?) I suspect this may be a combination of lack of talent in the forwards on the roster, as well as how coach John Hynes wants his team to play. There may be an opportunity to exploit the Devils down the left. The center and right lanes have some players with positive numbers.
So, now we’ve identified where the Devils are most vulnerable, but the Leafs would want to also key in on specific players that are most integral to the Devils shot generation. So, on the back end, that would be David Schlemko, and up front it would be Adam Henrique. How did I determine that? By looking at their Corsi Contribution percentage I touched on in Monday’s post.
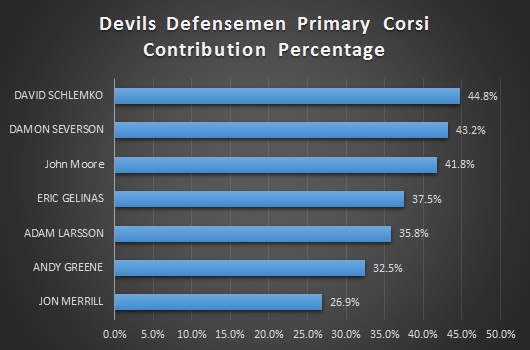
Here, we see that when Schlemko is on the ice, a larger share of primary shot attempt contributions are going to go through him in some fashion. Damon Severson is a close second.
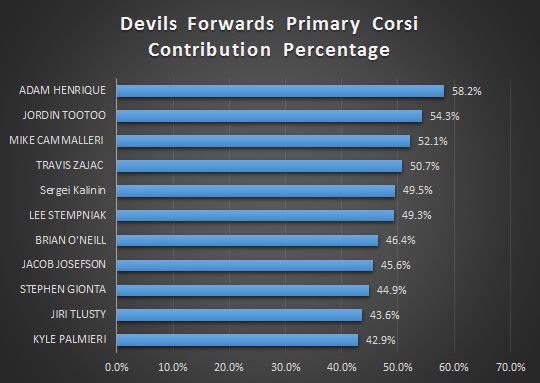
Important to note that, obviously, all of a team’s forwards are not on the ice at the same time. When you look at this chart, it simply tells you when that specific player is on the ice, how essential they are to generating offense. Henrique is the main provider of offense. To put it simply, the difference between Henrique and the next highest forward, is the same difference between the 2nd forward and the 6th. He has really come into his own this season.
So, how best to combat these primary contributors? By talking about something I’m calling passing zone and lane tendencies. What?
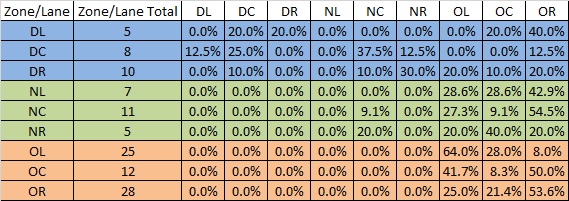
Through the point in the season where I took this Devils data (first 21 games), there were 694 shot assists in 5v5 situations. 394 of those were multiple passing sequences. So, it is in those 394 sequential events we can attempt to learn about the Devils passing tendencies and where to expect them to go with the puck.
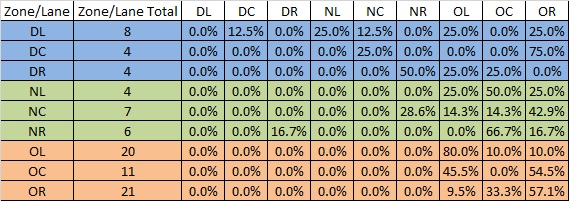
Below is a chart indicating what zone and lane (DL is for left lane of the defensive zone; NC is for center lane of the neutral zone, etc.) a pass originated (left column) and what zone and lane the following pass in the shot sequence was made (across the top). So, of the 32 shot assists completed from the left lane of the defensive zone, the Devils are most likely to have the next pass in the sequence originate in the either the left or center lane of the neutral zone. This chart simply answers: When the Devils are successful in completing passes, where are doing it?
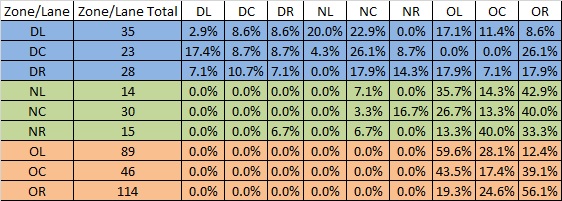
New Jersey Devils Zone&Lane Passing Tendencies
Following the above example, if the Devils are attempting a breakout of their zone and maintain possession that results in a shot attempt, they are more likely to do it from either side of the zone rather than centrally. Knowing this, it would be prudent to set up in such a way to take away what they so obviously like to do (breakout primarily on the left and then attempt to continue possession through the left and center of the neutral zone).
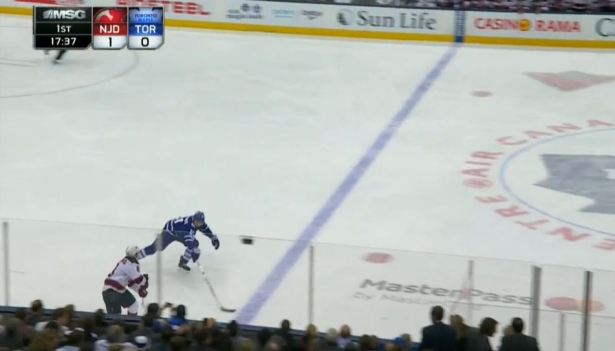
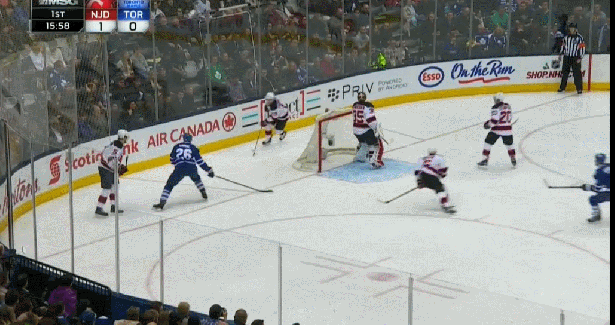
Here’s one example of the Devils moving from the center to the right, and then back across to their far side winger on a breakout.
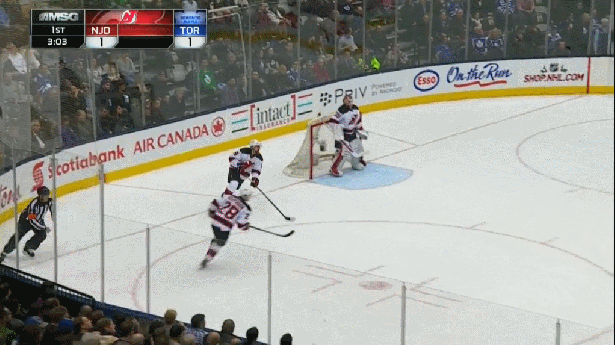
This comes just as a Toronto penalty expires. Peter Holland is applying pressure and cuts off the option for David Schlemko to go left. He dishes to Damon Severson who quickly sends it across to Stephen Gionta. His pass hits Gionta in stride and he is able drive the Leafs back before circling and setting up a shot from the point. While the breakout started in the center, the Devils were able to push down the ice from passing and presence on the wings.
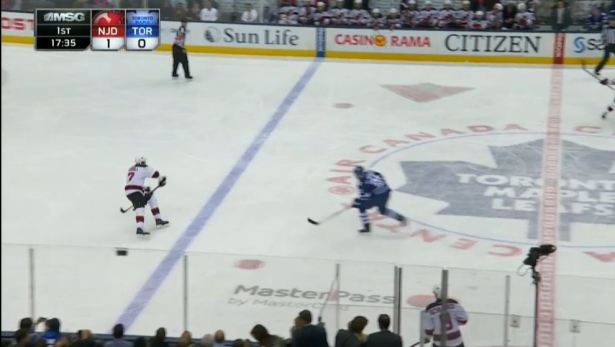
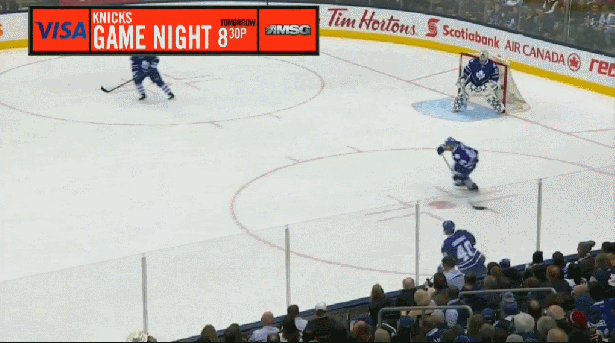
Now, the Devils tried similar versions of this breakout and the Leafs were all over it. The below screenshots illustrate what was far more common on this night.
Here’s Schlemko attempting to skate out of the zone and pass to an option higher up the ice. James Van Riemsdyk is applying pressure. None are available, so he has to dish back to Jon Merrill.
JVR is able to turn back and moves in to pressure Merrill. Merrill is left to attempt a pass to Brian O’Neill. Of course, before you even see the next screenshot, you’ll know it won’t be a positive outcome for the Devils due to the absence of Devils forwards in this picture. A Leaf is going to be on O’Neill right away.
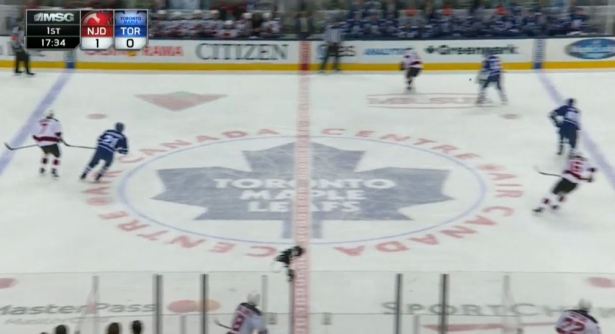
O’Neill basically has to just tip this into the zone and he is checked afterwards even without the puck. The Devils didn’t do a great job offering an intermediate passing option (or Merrill could have gone back to Schlemko) for an easier entry attempt. The Leafs prevented many of the Devils sustained possession and the result of this game was many dump-ins and tip-ins rather than the first example.
So, going back to Henrique and Schlemko now. We know the Devils are most vulnerable down their left. We know these two players drive possession for their team the most with respect to their position. The last piece of information we’d want to use is to analyze the zone & lane tendencies with each player on the ice. Let’s first look at how the Devils move the puck with Henrique on the ice.
Adam Henrique Zone&Lane Passing Tendencies
Through the neutral zone, we can clearly see a pattern that the Devils will move across the ice in transition and then try to set up on the right side of the offensive zone. These are smaller samples when we look at on-ice data for individual players, but patterns emerge fairly quickly.
Once inside the offensive zone, and this holds true for most teams, passes on the wings are generally followed by passes on that same wing as there is less room to maneuver.
David Schlemko Zone&Lane Passing Tendencies
For Schlemko, there are slightly fewer events, but the thing that stands out the most is in the offensive zone in the center lane. After each of the eleven passes made from there, the following pass was always from a wing. The team as a whole makes consecutive center lane passes in the offensive zone only 17.4% of the time, but to have none of them follow suit in Schlemko’s case is bizzare.
So, how did we see some of this play out this game? In addition to pressure in the neutral zone and interrupting entry attempts as shown above, the Leafs pressured the Devils in their own end as they tried to break out effectively. Here is an example of the Leafs relentlessly harassing the Devils until Henrique is forced to just dump out to relieve pressure.
Here, the Devils do not effectively negotiate the Leafs intense pressure, although they might have been able to if not for the Leafs Roman Polak stepping up to check Henrique and force a bad play from him. Again, he is their primary contributor, so any time you remove Henrique from the puck, the Devils shot generation takes a hit.
The Leafs are able to promptly come back down the ice, exposing the Devils lack of cover in transition down the left side.
Only Henrique is up to pressure as Stempniak is behind the play. Neither Cammalleri nor Andy Greene can get across or step up on this play, though they were bailed out by an offsides call. Either way, the Leafs had little work to do down the Devils left, once again.
So, using all of these types of analysis, we can formulate a picture of which players are the most important and how, where the team generates offense the most effectively and how, and also where the team is most vulnerable for your team to attack them. A coach and/or video analyst would likely instruct the team to set pressure triggers depending on the opposing personnel and situation (similar to what we saw when the Leafs blew up the Devils breakout above). Specifically, I would suggest keying on Henrique as he comes through the neutral zone. He is one of the team’s most effective passers in transition and the best way to slow a team down is to disrupt the genesis of their attack.
Shall we see what happened in this game?
The Game Data
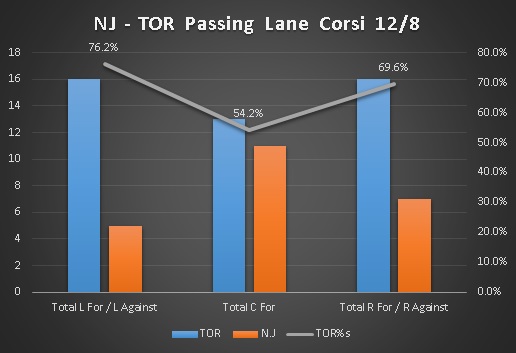
Toronto lit up the Devils as they pleased. They tore them apart on the wings and stayed just ahead down the center as well. Let’s see how this looked visually.
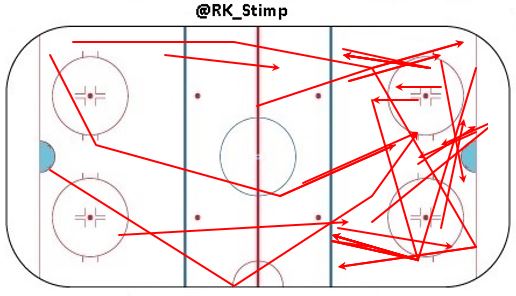
Toronto Shot Assists vs NJ 12/8
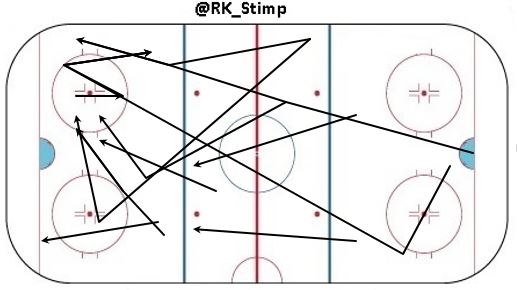
NJ Shot Assists vs TOR 12/8
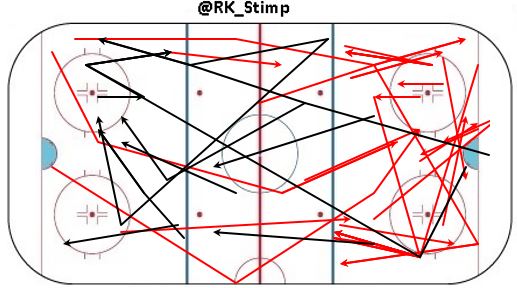
TOR (Red) vs NJ (Black) Shot Assists 12/8
The Leafs were able to carve up the Devils with multiple passes from behind the net and across in front – these are the highest levels of danger for any goalie. One curious note is that they did very little passing from point to point before shooting. Their shot sequences were relatively sustained and they worked well for preferred openings.
Conclusions
Okay, that was a lot and some might not have even made sense. There’s still tremendous amounts of work to do with this data. Like any new research, conclusions are really just pauses in the work to share and get feedback from the community. Where to go? What to reconsider? What to dig into further? After all, what I think might be the most important aspect might end up being relatively unimportant, and what I might have glossed over might end up being what matters the most.
However, from a practical standpoint and applying data to tactics, I think this could be the beginning of how we discuss and analyze the game more intelligently. Using data to offer sound tactical suggestion is the next step in hockey analytics. If a video analyst can note tendencies in the team’s opposition prior to playing them, a game plan can be constructed to give them an advantage. After all, if I know where and how you tend to create offense, I can deploy my team to pressure in key situations against specific personnel. The old adage you hear in American Football – take away their best player and make someone else beat you.
Tomorrow, our data will be yours to play with. Questions? Hit me up on Twitter at @RK_Stimp.
