
Back when the season started, I started playing around with the idea of how best to visualize our passing data. There will be plenty of time to arrange it in a viz to evaluate players like we did last season (Forwards, Defensemen), but there’s another way to present this data and that is within the realm of tactics and opposition analysis. Last December, I wrote a little preview of what we can do with this data by focusing on tendencies of how and where teams generate offense. If you haven’t yet, I encourage to read these pieces (all are linked in the beginning of that piece I just linked) for the background of what I’ve been imagining for this data since I added in lane concepts last summer.
We already know that passing is a skill and an important one at that, so there is always the importance for the descriptive and predictive levels of analytics (what has happened, what will happen), but one we don’t often discuss is the prescriptive level (what should we do). Combining data visualization of these events and video analysis is the best way forward. In this post, I’ll go over exactly how to use our new viz to pinpoint areas of the game to analyze. If you simply want to go to the viz, scroll to the bottom of this piece.
Before I get too far along, I want to give a massive stick tap to fellow Hockey-Graphs members, Sean Tierney and Conor Tompkins, for working with me on this viz. Making paths in Tableau is something I hadn’t done before (if interested on the topic, you can read more here) and there was a lot of back-and-forth and collaboration on how to get the data just right and how to present it in the best way. So, be sure to go thank Sean and Conor for their work on this as well.
Now, let’s get to it.
Data Driven Video Analysis
At present, the hockey analytics community does a good job of identifying players a team should acquire or stay away from. If we want to take our discussions to the next level, it is in microstats and video analysis that we will get there: unpacking the components of each phase of the game that fit within the framework of how the GM and coach want the team to play.
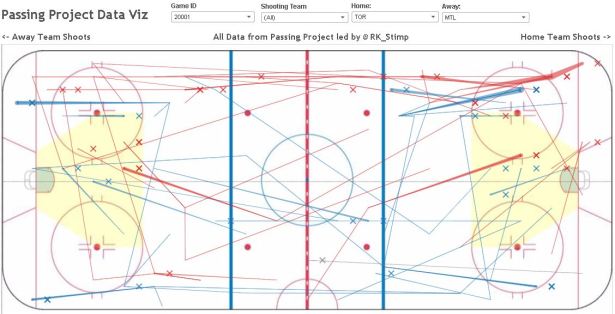
I’m going to use the New Jersey Devils’ home opener against the Winnipeg Jets back on October 9th as an example of what information one can uncover from our viz.
Let’s start with the Devils and their top line that evening of Travis Zajac, Lee Stempniak, and Mike Cammalleri. Their shot differential numbers for that game at 5v5 were as follows. Zajac: eight shots for, eleven against; Stempniak: eight shots for, nine against; and Cammalleri: eight shots for, nine against. All three under 50%, but exactly how was Winnipeg moving the puck and assisting on shots against this line? Let’s have a look at when Zajac, the line’s center, was on the ice.

As one can see, most of the shot generation via the pass was from the outside. With Stempniak on his left wing and Cammalleri on his right, most of the passing was pushed to the outside. Now, of course Zajac will be on the left and right sides of the ice during courses of the game, but it is important to know that of the 18,000+ 5v5 shots we’ve tracked, teams shoot 3% higher if the final pass comes from the center lane versus the left or right lanes. So, while Zajac may find his defensive responsibilities on either side of the ice as the play unfolds, limiting shot assists down his lane of the ice, positionally speaking, is a boon to the Devils defense.
Tyler Myers mostly played right defenseman with Toby Enstrom as his partner on the left. In this game at 5v5, Myers was on the ice for eleven shots for and seven against, a 61% Corsi. Enstrom was on the ice for eight shots for and seven against,a slightly worse 53% Corsi, due to the fewer shots generated with him on the ice. The box score here would suggest Myers had the better game due to the additional offensive output with him on the ice in his few shifts away from Enstrom. However, with this visualization, we know the Devils made a point of attacking down Winnipeg’s right side and putting pressure on Myers rather than Enstrom. Have a look.

You’ll notice the Devils did not assist on a shot down Winnipeg’s left side with Enstrom and Myers on the ice. They, either by circumstance or design, were most successful going down Myers’ side of the ice as opposed to centrally or down Winnipeg’s left. From Winnipeg’s standpoint, these present opportunities to review Myers’ defensive acumen and performance in this game.
Having these events time-stamped and organized like we do allows for more efficient assessment and pinpointing where to go in the video for deeper analysis. No metric or viz will tell the whole story, but the quicker you can identify where a team either failed or was successful in your exploratory analysis of the game, the quicker you can get to the root cause of each phase that preceded the shot.
How to Use the Viz
Okay, so this first viz will primarily be used for looking at individual games. You can look at multiple games for teams, but it will get messy quite quickly. I’ll put together a viz for each team so people can go more in-depth with season totals for players and matchups if that is something people would like.
You’ll need to keep in mind that these locations and directions are approximations based on the following criteria: zone in which the pass originated, lane in which the pass originated, whether it was a stretch pass, a pass back to the point, a pass from below the end line, or a pass across the Royal Road. The endpoint of the pass (X mark) doesn’t necessarily indicate where the shot was from. Combining our data with x,y data from various sites is a skill I have not yet mastered (in time!), so that is why you’ll see some passes listed under scoring chances, but were made outside the home plate area – the recipient likely took that pass and skated in for a scoring chance themselves.
The Game Id filter will pull up a specific game that we’ve tracked. You can find the game ID as the 5-digit number in the URL of boxscores and play-by-play files on the NHL site.
The Shooting Team filter represents the shooting team, so if you wanted to look at all shot assists for both teams in a game, you’d leave it set to “All”; if you wanted to solely look at how a team attacked or defended, you would filter by that team designation.
Once you’ve selected a game to view (or multiple), you would want to set the Home and Away teams in the Home and Away filters.
Home & Away Player filters are for typing in a player’s name to see how the team passed/was passed on with that player on the ice. So, in the example above, you could look at how a specific forward matchup played out, or a defenseman and a forward, etc.
The Shooter filter identifies which player shot upon receiving a pass. The Primary, Secondary, & Tertiary Passer filters indicate which player passed the puck with respect to the sequence.
Strength filters by man-situation (5v5, 5v4, 4v5, etc.). Through some quirk that I haven’t quite figured out, there’s a rogue 5v5 option that is blank. So, you want to select the second 5v5 option in the filter.
Zone is where you can type in the start and end of a sequence. The order follows a primary-secondary-tertiary sequence, so if you want to look at only primary passes in the offensive zone, you would type in OZ. If you wanted to look at passing sequences with one pass in the offensive zone and the secondary pass in the neutral zone, you would type OZ, NZ.
Lane is similar to the Zone filter in that you bring up passes made in the Left, Right, and Center lanes on the ice. This again follows the primary-secondary-tertiary sequencing, so if you wanted to look at a team’s secondary/tertiary passing at center ice, followed by passes made on the left side of the ice, you would type in L, C, C while selecting OZ, NZ, NZ (or DZ) in the Zone filter. You can map out how teams attacked/defended with a player on the ice in a given situation. The possibilities are endless.
Finally, you can filter out Scoring Chances and non-Scoring Chances as well. Or select “All” to include all shots.
Conclusions
Ideally, NHL teams are collecting data on three phases of the game: Zone Exits and Exit Assists, Zone Entries and Entry Assists, and Shots and Shot Assists. By quantifying the first two, you would pick up invaluable information that is not collected in our data, simply because we are focused on everything peripheral to the shot. Some view this as a flaw in our work, but we are but humble volunteers doing this in our free time. I do believe that the most value through tracking and quantifying all phases of the game will come on those who make plays (exits, entries, shots) and those that assist in the creation of those events. Doing so allows a team’s opposition analysts to quantify how best to attack each phase of the game (breakout, transition, entry, shot generation).
This is a first stab at this, so there still might be a bug or two (or fifteen) to work out. As I mentioned above, I’ll likely put together ones for each team with more customization (i.e. adding 1-5 players that were on the ice) based on feedback from this one. If you have questions, comments, or simply want to complain because this isn’t perfect and that’s what the Internet is for, hit me up on Twitter.
