The relationship between competition and observed results is real and it’s spectacular

Raw Comp Impact

Abstract

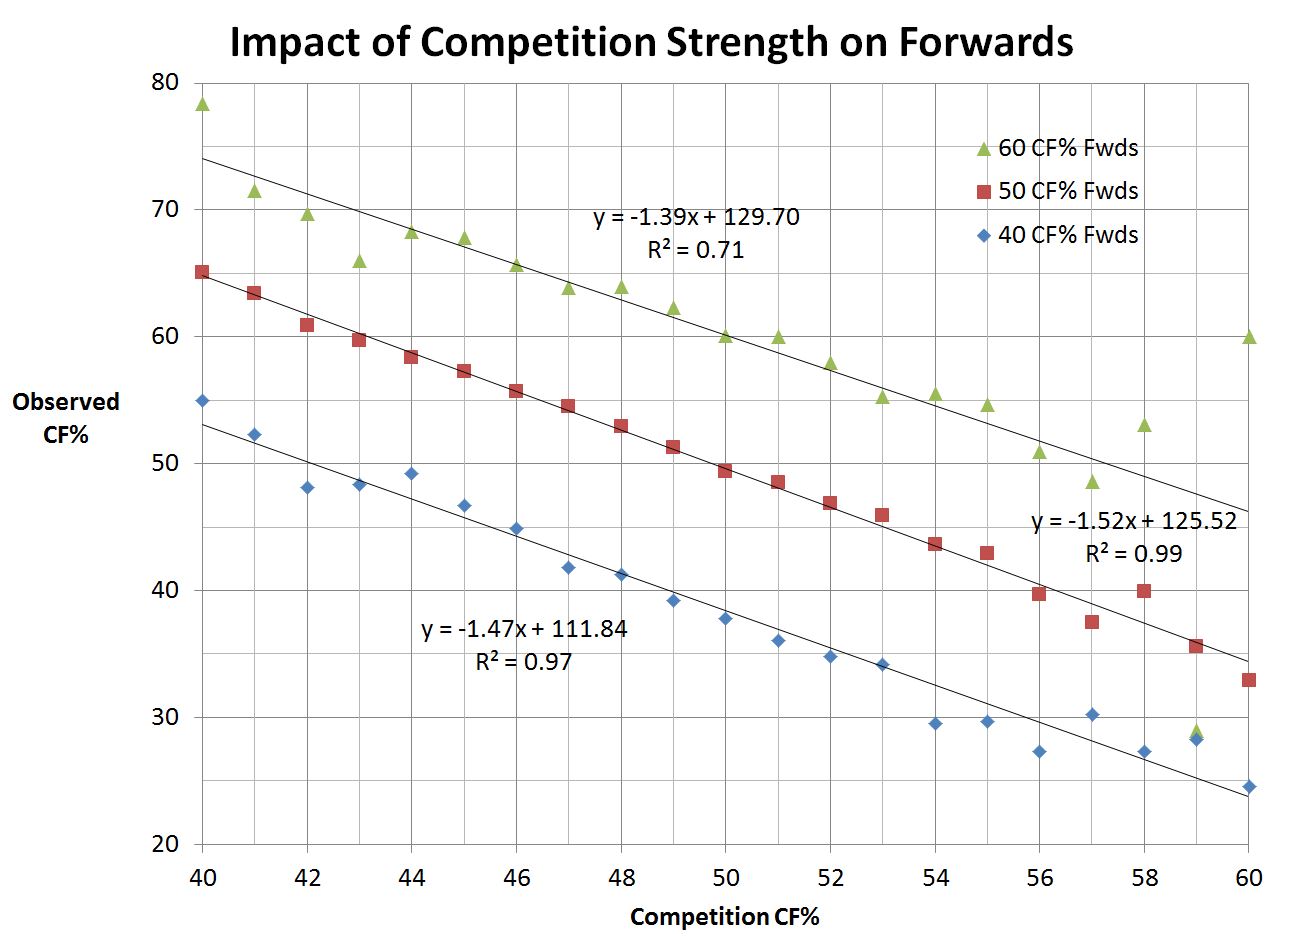
There has been much work over the years looking at the impact of competition on player performance in the NHL. Prompted by Garret Hohl’s recent look at the topic, I wanted to look at little deeper at the obvious linear relationship between Quality of Competition and observed performance.

The results are a mathematical relationship between competition and observed, which could provide insight into player performance over short time frames. In the long run, the conclusions drawn by Eric Tulsky still hold. The impacts of facing normally distributed Quality of Competition (QoC) will wash out the effects over time. But this should not preclude consideration and even adjustments for QoC when looking at smaller sample sizes.

Continue reading

#RITHAC Recap with Slides!

After a wildly successful Hockey Analytics Conference at the Rochester Institute of Technology, I wanted to say a few words of gratitude to everyone involved.

First off, this means a huge thank you to all that attended and viewed online. I really appreciate you taking the time out of your weekend to come listen to us all wax on about hockey analytics and things we spend hours laboring on. I feel I can speak for all the speakers when I say, it really does mean a lot to see that support and encouragement. So, thank you.

Next, to Matthew Hoffman and Paul Wenger, both professors at RIT. Matt was instrumental in paving the way to make this happen. Paul was a big hand helping out with the live stream and time-stamping the presentations so quickly after the conference ended. Huge thanks to both of them. Great guys and they deserve a ton of thanks for this event.

Continue reading

Hockey Graphs Top 50 NHL Players

Before the season begins there’s two lists that seem to cause a stir within the hockey community: the Top 50 Players in the NHL. The Hockey News puts out one in its annual season preview yearbook while TSN has an entire hour-long broadcast dedicated to it. Both lists are compiled in the same way (which is why they tend to be similar), and that’s via a poll of people inside hockey. That may be where some of the controversy lies.

It’s not necessarily that those guys are wrong about who’s the best of the best – it’s their job after all – it’s that their opinions tend to be moulded by a few biases that cloud their judgement. From looking at the list every year (and how it changes) it’s shaped a lot by recency bias, reputation and a winning pedigree.

I wanted a different take on the debate so I enlisted some of hockey’s top nerds doing work in the public sphere to share their opinions of who they think will be among the 50 best players in the league in this upcoming season.

Continue reading

Expected Goals are a better predictor of future scoring than Corsi, Goals

newplot

This piece is co-authored between DTMAboutHeart and asmean.

Introduction

Expected goals models have been developed in a number of sports to better predict future performance. For sports like hockey and soccer where goals are inherently random and scarce, expected goals models proved to be particularly useful at predicting future scoring. This is because they take into account shot attempts, which are better predictors of a team and player’s performance than goal totals alone. 

A notable example is Brian Macdonald’s expected goals model dating back to 2012, which used shot differentials (Corsi, Fenwick) and other variables like faceoffs, zone starts and hits. Important developments have been made since then in regards to the predictive value of those variables, particularly those pertaining to shot quality.

Shot quality has been the subject of spirited debate despite evidence suggesting that it plays an important role in predicting goals. The evidence shows that shot characteristics like distance and angle can significantly influence the probability of a certain shot resulting in a goal. Previous attempts to account for shot quality in an expected goals model format have been conducted by Alan Ryder, see here and here

In Part I, an updated expected goals (xG) model will be presented that accounts for shot quality and a number of other variables. Part II will deal with testing the performance of xG against previous models like score-adjusted Corsi and goals percentage.

Continue reading

Paul Bissonnette is Wrong and Right

Photo by Michael Wifall, via Wikimedia Commons; altered by author

Photo by Michael Wifall, via Wikimedia Commons; altered by author

From the outset, I want to say the Player’s Tribune, conceptually, is a wonderful thing. To have players guest post or answer questions without the emotions of a post-game presser or rigid formality of a journalist interview provides great insight to their personalities. And just like anybody we’d encounter in daily life, they say things we agree with, things we don’t agree with, or things we might’ve worded differently. Take, for instance, today’s “Mailbag” with Paul Bissonnette. A majority of the interview, which were questions from readers, were your general enforcer interview questions: best fight, worst fight, scary fight, do you like to fight, etc.

But then there was this final question, which I can only assume came from Mark Spector:

Bissonnette Players Tribune II

Bissonnette’s response, his longest of the interview, was chock full of wrong, with plenty of right on the side.

Continue reading

Prospect Cohort Success – Evaluation of Results

2008 NHL Entry Draft Stage.JPG
2008 NHL Entry Draft Stage” by Alexander Laney. Licensed under CC BY-SA 3.0 via Commons.

Identifying future NHLers is critical to building a successful NHL team. However, with a global talent pool that spans dozens of leagues worldwide,  drafting is also one of the most challenging aspects of managing an NHL team. In the past, teams have relied heavily on their scouts, hoping to eek out a competitive advantaging by employing those who can see what other scouts miss. Quite a challenge for many scouts that may only be able to watch a prospect a handful of times in a season. While there has been some progress in the past few years with teams incorporating data into their overall decision making, from the outside, the incorporation of data driven decision making in prospect evaluation has been minimal.

To address this, Josh Weissbock and myself have developed a tool for evaluating prospect potential which we call Prospect Cohort Success (PCS), with the help of others in the analytics community including Hockey Graphs Supreme Leader, Garret Hohl.

Continue reading

Exceeding Pythagorean Expectations: Part 5

“Bryz-warmup” by Arnold C. Licensed under Public Domain via Commons.

Bryz-warmup” by Arnold C. Licensed under Public Domain via Commons.

This is the fifth part of a five part series. Check out Part 1, Part 2, Part 3, Part 4 here. You can view the series both at Hockey-Graphs.com and APHockey.net.

To quickly recap what I’ve covered in the first four parts of this series, I have updated the work that’s been done on Pythagorean Expectations in hockey, and am looking to find out whether teams that have the best lead-protecting players are able to outperform those expectations consistently.

The first step is to figure out how to assess a player’s ability to protect leads. To do this, for every season, I isolated every player’s Corsi Against/60, Scoring Chances Against/60, Expected Goals Against/60 (courtesy of War-On-Ice) and Goals Against/60 when up a goal at even strength. I then found a team’s lead protecting ability for the year in question by weighting those statistics for each player by the amount of ice time they winded up playing that year. For players that didn’t meet a certain threshold, I gave them what I felt was a decent approximation of replacement level ability. For example, here was the expected lead protecting performance of the 2014-2015 Anaheim Ducks in each of those categories.

Screen Shot 2015-09-12 at 4.04.51 PM

Now let’s look a little closer at our Pythagorean Expectation — derived through PythagenPuck.

Continue reading

Exceeding Pythagorean Expectations: Part 4

“Zdeno Chara 2012” by Sarah Connors. Licenced under Public Domain via Commons.

Zdeno Chara 2012” by Sarah Connors. Licensed under Public Domain via Commons.

This is the fourth part of a five part series. Check out Part 1, Part 2, Part 3, Part 5 here. You can view the series both at Hockey-Graphs.com and APHockey.net.

So now, four parts into this five part series, is probably a good time to discuss my original hypothesis and why I started this study.

As I mentioned in my previous post, baseball has already gone through its Microscope Phase of analytics, where every broadly accepted early claim was put to the test to see whether it held up to strict scrutiny, and whether there were ways of adding nuance and complexity to each theory for more practical purpose. One of the first discoveries of this period was that outperforming one’s Pythagorean expectation for teams could be a sustainable talent — to an extent. Some would still argue that the impact is minimal, but it’s difficult to argue that it’s not there.

What is this sustainable talent? Bullpens. Teams that have the best relievers, particularly closers, are more likely to win close games than those that don’t. One guess that I’ve heard put the impact somewhere around 1 win per season above expectations for teams with elite closers. That’s still not a lot, but it’s significant. My question would be, does such a thing exist in hockey?

Continue reading

Exceeding Pythagorean Expectations: Part 3

“Pythagorus Algebraic Separated” by John Blackburne. Licenced under Public Domain via Commons. The 2006 Red Wings may have been the best hockey team since the lost season.

Pythagorus Algebraic Separated” by John Blackburne. Licenced under Public Domain via Commons. The 2006 Red Wings may have been the best hockey team since the lost season.

This is the third part of a five part series. Check out Part 1, Part 2Part 4, Part 5 here. You can view the series both at Hockey-Graphs.com and APHockey.net.  

Since the last post was getting a little long, I decided to hold off on releasing the full Pythagorean results.

Continue reading

Exceeding Pythagorean Expectations: Part 2

“Pythagorus Algebraic Separated” by John Blackburne. Licenced under Public Domain via Commons. The 2006 Red Wings may have been the best hockey team since the lost season.

Pythagorus Algebraic Separated” by John Blackburne. Licenced under Public Domain via Commons.

This is the second part of a five part series. Check out Part 1, Part 3, Part 4, Part 5 here. You can view the series both at Hockey-Graphs.com and APHockey.net.

In Part 1, I looked at some of the theory behind Pythagorean Expectations and their origin in baseball. You can find the original formula copied below.

WPct = W/(W+L) = Runs^2/(Runs^2 + Runs Against^2)

The idea behind the formula is that it is a skill to be able to score runs and to be able to prevent them. What isn’t a skill, however — according to the theory — is when one scores or allows those runs. Teams over the course of weeks or months may appear to be able to score runs when they’re most necessary, to squeak out one-run wins, but as much as it looks like a pattern, it is most often simple variance. If you don’t fully buy into that idea, or you don’t really understand what I mean by variance, read this and then come back. Everything should be a lot clearer.

When applying Pythagorean Expectations to hockey, there are a couple of factors that complicate the matter.

Continue reading