
Competition Histograms by Eric Tulsky from NHL Numbers, Sep 23, 2012
ABSTRACT
We know that linemates have a larger impact on results than competition on the average. This has caused many to change player deployment chart axis from QoC to QoT metrics.
However, it’s not quite that simple.
The area of contextually nuanced studies with numbers like competition and teammate metrics is still well in its infancy. We have a general idea of what’s going on but there is a lot of information in the details.
We show here that a 1 percentage point change in teammate and competition Corsi% has an equal but opposite impact on observed output, but there are some differences. The distribution in the NHL is much smaller with competition. However, unlike with competition Corsi%, teammate Corsi% impact is not the same for all players.
BACKGROUND
The story of analysis never ends with simply looking at the players with the best results. One must always investigate further and ask themselves: Why?
This drove research into deployment and usage factors. Intuitively it all makes sense: play with better and you will do better, play against better opposition and you will do worse.
Not long ago, Eric Tulsky looked at competition factors at NHL Numbers. The hockey analytics community saw two changes come from this research:
- Ice time became a preferred measure over shot metrics
- Impacts of “line matching” moved from being important, to overrated, and then eventually inconsequential
Then research stopped. Not much more had been done despite huge gaps in our knowledge.
IMPACT OF DEPLOYMENT
First we will look at the impact of facing different opponents in a similar way to Tulsky:
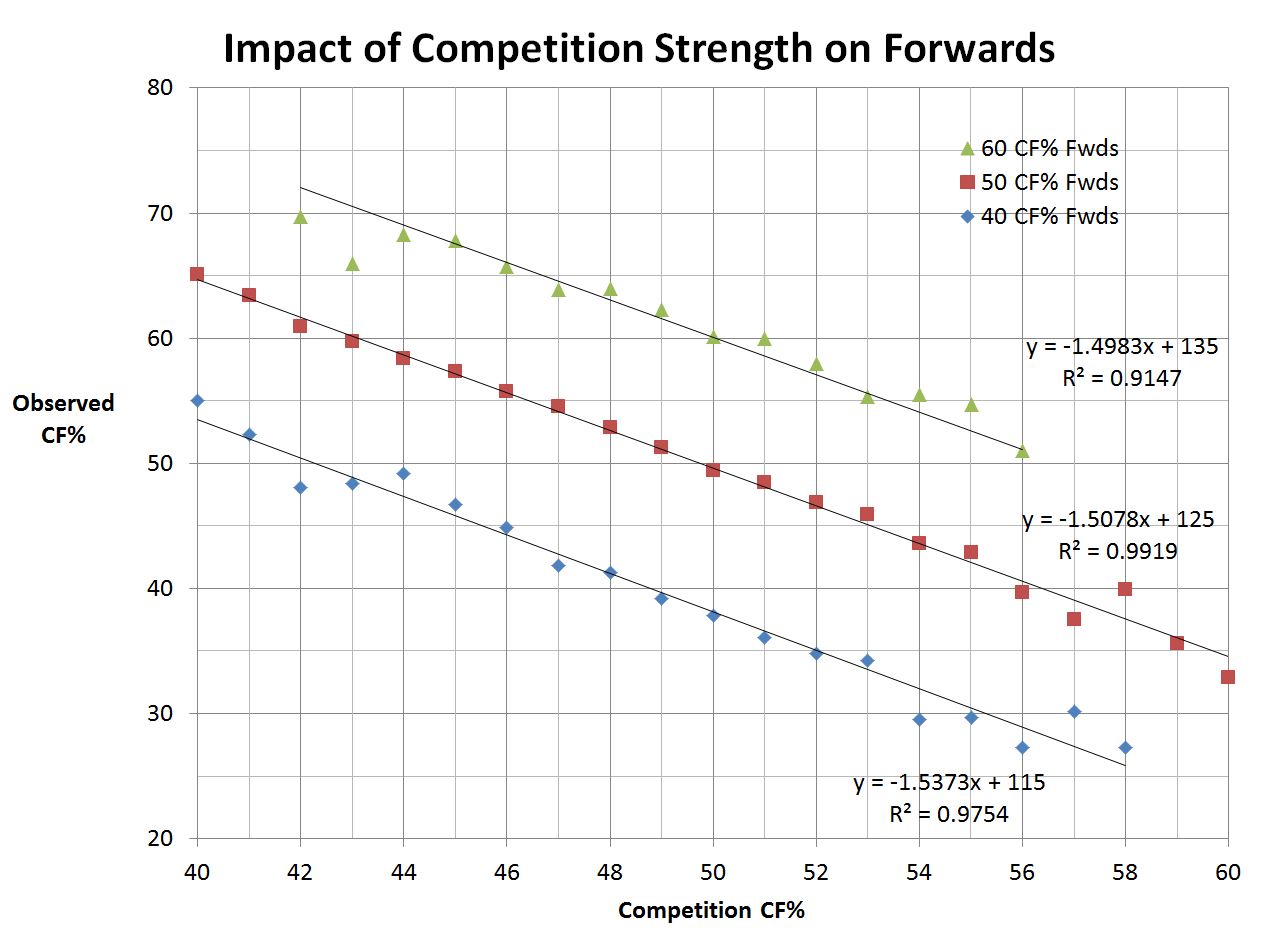
Note: Data points with less than 500 events were removed.
There are some changes to Tulsky’s method. Tulsky looked at competition Corsi as a differential, while using Corsi% as the observed output. Here we use the same measure for both variables.
We see from this graph, as one would guess, that playing against a tougher opponent reduces the observed result one should expect. You are going to perform against Tanner Glass a lot better than you would against Sidney Crosby.
There are two interesting aspects to the slope.
- The slope is essentially the same for all players: good, average, or bad
- The trade-off is not 1:1
What about linemates? Is the impact of playing with better the same?
I repeated the same exercise, but instead of looking at the Corsi% of the competition, I looked at the Corsi% of the four other linemates when away from the forward in question.

Note: Data points with less than 500 events were removed.
The results are a tad surprising.
We do not see the impact being quite the same for linemates as it is for line matching and competition. The slope is not the same for all player levels.
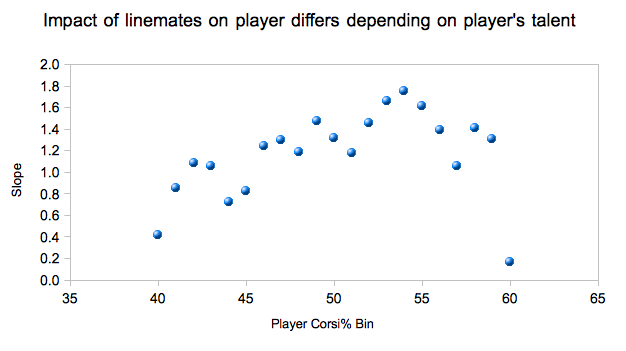
The extrema makes sense. Extremely weak and strong players rarely line up with players of the opposite end of the spectrum. Usually these are cases of incomplete line changes, being caught from an icing, or a team getting pinned in their own defensive zone for a large percentage of time.
Even when we move more towards the median, there exists a large amount of variance. With competition Corsi%, all of the player bins carried a slope magnitude between 1.4 to 1.6, even when splitting the data into 21 bins (40, 41, 42, 43,…60). Only three of the 21 bins sat within that range for teammate Corsi%.
However, the average slope between all the player bins for teammates is the same magnitude we see with competition – although in the opposite direction.
DIFFERENCE IN DEPLOYMENT
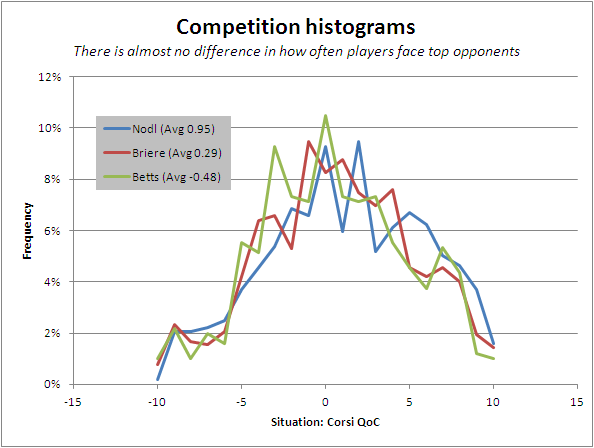
The next thing Tulsky did was ask how much deployment differed. He showed that the distribution throughout the NHL for competition tended to be a lot smaller than many realized.

We can see here that the distribution for competition is indeed a lot smaller.
Teammate Corsi% has about 5 times the deviation and variance that competition Corsi% has.
FINAL THOUGHTS
We see here that an increase of 1 percentage point in teammate Corsi% has an equal but opposite impact (+1.5) in observed results as competition Corsi% (-1.5). The distribution of teammate Corsi% in the NHL is greater than competition Corsi%.
This can lead many to throw away competition and look at linemates exclusively; however, this can be dangerous.
While the distribution in teammate Corsi% is larger, it is only about 5x larger. The average impact of the two metrics on observed results are equal in magnitude. There will be players that differ similarly in either metric, or may experience a larger difference from the mean in competition Corsi% than teammate Corsi%.
Competition is still a real variable.
The other issue is that the impact of linemates is still messy and further investigation must be done to account for the differences in impact on different players.
I think we have it right: your teammates, especially most common linemates, will impact your results more than how your coach tends to line match you. No matter how much a coach tries, there are still changes on the fly and the opposing coach muddying the line matching.
In addition, there is the problem of measuring the competition and linemates. We know that not all Corsi% is the same. A 50% Corsi player on a fourth line does not demonstrate the same talent as a 50% Corsi player on a top line. Ice time has a similar issue as well; a 13-minute per game forward on a contending team does not have the same talent level as a 13-minute per game forward on a lottery pick team.
Research in deployment factors like linemates and opposition has slowed down, but there is still a lot of work to be done.
Thank you to Muneeb Alam and PetBugs for assisting me in data accumulation and visuals.

I’d love a graph plotting the end of regular season position of every team throughout the NHL’s history something like this http://outsideoftheboot.com/wp-content/uploads/2012/12/premier-league-winners-league-positions-since-1999-00-season.png . would be interesting to see how salary caps, relocations affected the league. see regeneration cycles post salary cap.
Wouldn’t be too difficult to do; I’ll look into it this weekend.