Exceeding Pythagorean Expectations: Part 5

“Bryz-warmup” by Arnold C. Licensed under Public Domain via Commons.

Bryz-warmup” by Arnold C. Licensed under Public Domain via Commons.

This is the fifth part of a five part series. Check out Part 1, Part 2, Part 3, Part 4 here. You can view the series both at Hockey-Graphs.com and APHockey.net.

To quickly recap what I’ve covered in the first four parts of this series, I have updated the work that’s been done on Pythagorean Expectations in hockey, and am looking to find out whether teams that have the best lead-protecting players are able to outperform those expectations consistently.

The first step is to figure out how to assess a player’s ability to protect leads. To do this, for every season, I isolated every player’s Corsi Against/60, Scoring Chances Against/60, Expected Goals Against/60 (courtesy of War-On-Ice) and Goals Against/60 when up a goal at even strength. I then found a team’s lead protecting ability for the year in question by weighting those statistics for each player by the amount of ice time they winded up playing that year. For players that didn’t meet a certain threshold, I gave them what I felt was a decent approximation of replacement level ability. For example, here was the expected lead protecting performance of the 2014-2015 Anaheim Ducks in each of those categories.

Screen Shot 2015-09-12 at 4.04.51 PM

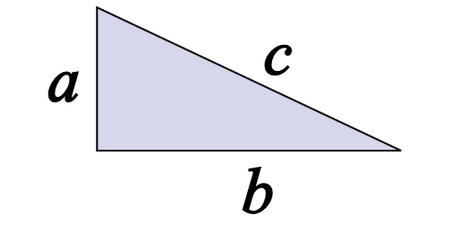
Now let’s look a little closer at our Pythagorean Expectation — derived through PythagenPuck.

Continue reading

Exceeding Pythagorean Expectations: Part 4

“Zdeno Chara 2012” by Sarah Connors. Licenced under Public Domain via Commons.

Zdeno Chara 2012” by Sarah Connors. Licensed under Public Domain via Commons.

This is the fourth part of a five part series. Check out Part 1, Part 2, Part 3, Part 5 here. You can view the series both at Hockey-Graphs.com and APHockey.net.

So now, four parts into this five part series, is probably a good time to discuss my original hypothesis and why I started this study.

As I mentioned in my previous post, baseball has already gone through its Microscope Phase of analytics, where every broadly accepted early claim was put to the test to see whether it held up to strict scrutiny, and whether there were ways of adding nuance and complexity to each theory for more practical purpose. One of the first discoveries of this period was that outperforming one’s Pythagorean expectation for teams could be a sustainable talent — to an extent. Some would still argue that the impact is minimal, but it’s difficult to argue that it’s not there.

What is this sustainable talent? Bullpens. Teams that have the best relievers, particularly closers, are more likely to win close games than those that don’t. One guess that I’ve heard put the impact somewhere around 1 win per season above expectations for teams with elite closers. That’s still not a lot, but it’s significant. My question would be, does such a thing exist in hockey?

Continue reading

Exceeding Pythagorean Expectations: Part 3

“Pythagorus Algebraic Separated” by John Blackburne. Licenced under Public Domain via Commons. The 2006 Red Wings may have been the best hockey team since the lost season.

Pythagorus Algebraic Separated” by John Blackburne. Licenced under Public Domain via Commons. The 2006 Red Wings may have been the best hockey team since the lost season.

This is the third part of a five part series. Check out Part 1, Part 2Part 4, Part 5 here. You can view the series both at Hockey-Graphs.com and APHockey.net.  

Since the last post was getting a little long, I decided to hold off on releasing the full Pythagorean results.

Continue reading

Exceeding Pythagorean Expectations: Part 2

“Pythagorus Algebraic Separated” by John Blackburne. Licenced under Public Domain via Commons. The 2006 Red Wings may have been the best hockey team since the lost season.

Pythagorus Algebraic Separated” by John Blackburne. Licenced under Public Domain via Commons.

This is the second part of a five part series. Check out Part 1, Part 3, Part 4, Part 5 here. You can view the series both at Hockey-Graphs.com and APHockey.net.

In Part 1, I looked at some of the theory behind Pythagorean Expectations and their origin in baseball. You can find the original formula copied below.

WPct = W/(W+L) = Runs^2/(Runs^2 + Runs Against^2)

The idea behind the formula is that it is a skill to be able to score runs and to be able to prevent them. What isn’t a skill, however — according to the theory — is when one scores or allows those runs. Teams over the course of weeks or months may appear to be able to score runs when they’re most necessary, to squeak out one-run wins, but as much as it looks like a pattern, it is most often simple variance. If you don’t fully buy into that idea, or you don’t really understand what I mean by variance, read this and then come back. Everything should be a lot clearer.

When applying Pythagorean Expectations to hockey, there are a couple of factors that complicate the matter.

Continue reading

Exceeding Pythagorean Expectations: Part 1

Screen Shot 2015-09-13 at 9.13.44 PM

Nashville Predators vs Detroit Red Wings, 18. April 2006” by Sean Russell. Licensed under Public Domain via Commons. The 2006 Red Wings may have been the best hockey team since the lost season.

This is the first part of a five part series. Check out Part 2, Part 3, Part 4, Part 5 here. You can view the series both at Hockey-Graphs.com and APHockey.net.

The 2015-2016 NHL season is almost here, and our sport has come upon a new phase — arguably the third — in its analytics progression.

Continue reading