Some day we will reach the point where we can comprehensively analyze which power plays are the best, which players drive that success, and most elusively, what roles to place players in to maximize a unit’s output, but statistically, our special teams cupboard is pretty bare. This season, as many of you know, I took on the long and arduous task of hockey tracking in the interest of trying to get us even one step closer to our objective: how can we better evaluate and predict power play success? So let’s dive right in. Continue reading
NHL League-Wide Analysis
NHL League-Wide Analysis pieces are analyses that take evidence from across the league to identify trends.
Can defensemen control rebound opportunities? Putting the eye test to the test.
One of the attributes that is often attached to defensemen is the ability to clear rebounds. You hear this quite often on NHL broadcasts, usually after a flurry of rebound shots that ultimately wind up in a goal. The colour commentator will jump in and imagine the goalie is saying to his defensemen, “I’ll stop the first three, you get the fourth one.”
But just how much is there to defensemen’s ability to prevent rebound shots?
Continue reading
Examining League-wide Offense and Defense
Over the holidays, I created some charts that show the distribution and density of Shots and Scoring Chances for Per 60 for each team. There’s a lot of information in these charts, so I chose a few to inspect further.
First, we’ll look at the league-wide chart for Shots and Scoring Chances For. Keep in mind that each individual dot is a game, and the contour lines show the density of the dots (i.e. how close they are to each other).
How Hard is It to Find Good NHL Goaltending?

Is Jacob Markstrom still good?
Whether you come at hockey from the numbers or from traditional scouting, finding NHL-quality goaltending is a challenge. In order to have a good sense of a goalie’s talent (as measured by even-strength Sv%), you need to observe about 4,000 shots worth of work. On average, a goalie needs to play over three seasons as a starter (or eight seasons as a backup) to see that many shots. If they play poorly, few netminders will ever get close to that amount of playing time and most goalies are entering age-related decline by the time they’ve seen that many shots. As such, teams usually make decisions on goaltenders long before they’ve seen 4,000 shots and, unsurprisingly, teams make mistakes.
What determines coach salaries? A look at NHL bench bosses
This summer, the drama surrounding Mike Babcock drew my attention to the salaries of coaches in general. What factors play into how much money a coach earns? Babcock is known as a coach who’s won at every level. Are Stanley Cup wins a factor in what a coach gets paid? Maybe playoff wins? Regular season won-loss records? Something else?
Babcock’s contract – a mammoth 8 year long pact worth $50 million to coach the Leafs – brought the subject of coaching salaries to the forefront. At $6.25 million per season, Babcock earns more than double the annual pay of any other NHL coach with a publicly known wage.
For the Leafs, spending huge amounts of cash on team personnel makes sense – there’s no cap on coach salaries so that Leafs can wield their monetary advantage to sign the best bench boss available. For Babcock, it’s difficult to fault the long-time Red Wings coach for taking the big pay day. Beyond enriching himself (which he really, really did), Babcock has been very open about his desire to push coach salaries forward by setting a new standard. He probably didn’t imagine he’d earn more than Joel Quenneville and Darryl Sutter combined or that his term would extend three years past any other NHL coach. But, as perhaps the game’s best coach, the Leafs were willing to pay whatever was needed to pry Babcock out of Detroit.
But what types of thinking go into deciding how much a team is willing to pay its coach? Did Babcock earn the money because of his vast experience? Or maybe his excellent regular season record over a decade in Detroit? What factors correlate with coach salaries?
Distribution of Quality of Competition and Teammates Metrics
The analysis community has studied these metrics in various ways. The purpose of this post is to lay out the way I understand the metrics, and identify areas of additional research.
The effects of competition and teammates on players are not new concepts in hockey. We hear about it all the time in analysis and conversation: “Jonathan Toews is deployed by his coach to specifically shut down the top players of the opposition”, “4th liners play against the opposing 4th line”, “Sidney Crosby makes his teammates better”, etc. etc.
Having analyzed the metrics used to quantify quality of competition and teammate, I came to two conclusions.
Are there unintended consequences to the coach’s challenge?
On a Canucks broadcast earlier this season, Sportsnet’s John Garrett pointed out that we seem to be getting a lot more offside calls this year. And for once, I actually agreed with him.
Garrett theorized that maybe this was an unintended consequence of the coach’s challenge. Perhaps linesemen don’t want to be responsible for having a goal called back because they got the call wrong at the blue line. So if it’s a close call, just be conservative and whistle it down. Coaches can’t challenge an offside call, after all.
The NHL introduced a coach’s challenge to try and get more calls right. And clearly, it should be in everyone’s interest to do so. But what if we’re not just getting more calls right? What if we’re also getting more calls, period?
Ever since that broadcast, every game I’ve watched seems to be rife with offside calls on any play even remotely close at the blue line. It doesn’t matter the player, the team or the score. Bobble the puck? Offside. Drag the skate? Offside. Make an extra move? Offside.
At best this is slowing down the game, but could it also be contributing to the reduced scoring we’ve seen so far this season?
If so, this is an observation that both John Garrett and I picked up on just by watching the games. Maybe Brian Burke is right and hockey really is an eyeballs sport.
Let’s find out.
Exploring the Impact of New NHL Coaches and GMs
With Todd Richards being let go after a disastrous 0-7 start by the Blue Jackets, and Bruce Boudreau on the hot seat (heck, he might be out of a job by the time I finish writing this), coaching is once again in the spotlight. After Richards was fired, I went on a mini rant about how I believe having a good GM is more important than having a good coach, and while I still believe this is true, I wouldn’t be a data person unless I tried to prove it.
This project has many parts to it. The first, which I’ll be doing here, is just looking at the breakdown of Scoring Chances For% compared to Coaches and GMs in the early days of their tenure, i.e. right after being hired. Scoring Chances, to simplify things, are basically “more dangerous shots” (click here for a more rigorous definition).
To start, I needed data. I pulled all 30 teams from 2006/07 to 2015/16, and coded each season by what kind of organizational changes happened within. This gave me 331 data points, as there were often midseason coaching or GM hirings to account for.
The states broke down like this:
1) No Change – 64%
2) Hired a new Coach – 21.5%
3) Hired a new GM – 7.3%
4) Hired a new Coach & new GM – 7.3%
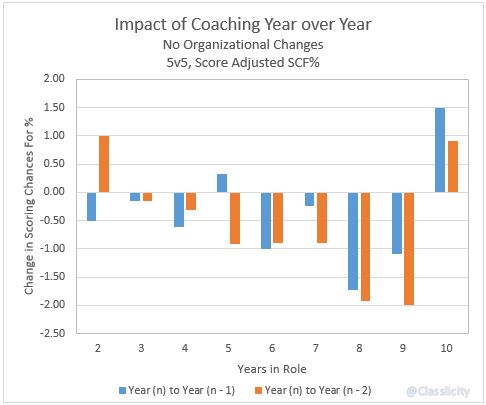
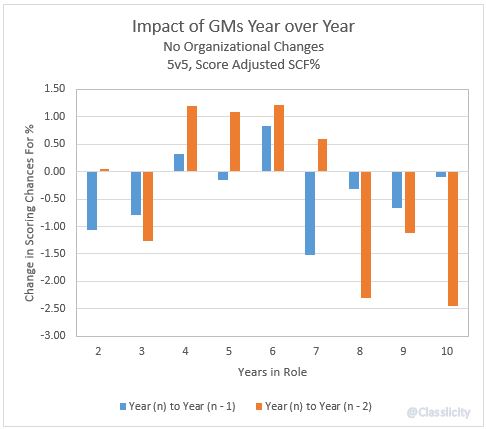
In looking at the data, some patterns quickly emerged. The first two years of tenure in either role were where the most change, for better or worse, happened.
Because I had so much data in the No Change category, I wanted to see if there was any sort of trend year over year for the control group.
xSV% is a better predictor of goaltending performance than existing models
This piece is co-authored between DTMAboutHeart and asmean.
Analysis of goaltending performance in hockey has traditionally relied on save percentage (Sv%). Recent efforts have improved on this statistic, such as adjusting for shot location and accounting for goals saved above average (GSAA). The common denominator of all these recent developments has been the use of completed shots on goal to analyze and predict goaltender performance.
Some Things to Know about One-Goal Games
Last season, as hockey analysts struggled to explain how a possession-dominant Kings team failed to make the playoffs while Anaheim and Vancouver topped 100 points, there was a lot of discussion surrounding the role of one-goal games in the standings. LA’s disappointing season was largely dismissed as bad luck, with an argument that went something like this: the outcome of a one-goal game is effectively random, and the Kings’ 13-9-15 record in these games (against the 33-1-7 and 22-4-5 performances of the Ducks and Canucks, respectively) was the difference in keeping them out of the postseason. I wasn’t entirely convinced by this, but it got me thinking about the randomness of close contests. How random are one-goal games, and how significant a problem is this for people trying to use numbers to understand why some teams win and others don’t?


