
This piece is co-authored between DTMAboutHeart and asmean.
Analysis of goaltending performance in hockey has traditionally relied on save percentage (Sv%). Recent efforts have improved on this statistic, such as adjusting for shot location and accounting for goals saved above average (GSAA). The common denominator of all these recent developments has been the use of completed shots on goal to analyze and predict goaltender performance.
To date, no attempt has been made to look at missed shots despite a goaltending adage suggesting that the most skillful goaltenders not only make the saves but also “force” opponents to miss the net. Consider the following passage:
“Many of the things you do during a game without making a save may not show up in the game summary or on the highlight reel but do show up in the win column. It could be tipping a pass from behind the net, leaving the puck in a good position for your defense, making a great angle play that forces the shooter to miss the net, or clearing the zone for your team with a hard shot off the glass. Setting up on the right angle, taking the net away from the shooter, and adjusting your depth based on reading the position of the opposition are just as important as making the big save. You play a special position and must pay attention to these and many other details during a game. That is what separates the average goalies from the best goalies.”
-Excerpt from Hockey Goaltending (2009), a book by Brian Daccord
Brian Daccord suggests that forcing shooters to miss the net is a skill that “separates the average goalies from the best goalies”. Interestingly, he mentions positioning (“making a great angle play”) as a contributor to opponents missing the net. Others have added that goaltender size and general playing style (e.g. butterfly) may also contribute to this phenomenon. Presently, no conclusive evidence exists to support these observations, much less the theory that goaltenders forcing the opposition to miss the net is a skill to begin with.
To this end, the repeatability of this theory will be assessed using Fenwick (shots on goal plus missed shots) Sv % in Part I. In Part II, an expected saves model that predicts how many goals a goaltender is expected to concede based on Fenwick Sv % and shot quality variables will be presented. Part III will deal with testing the performance of the model against raw Fenwick Sv%.
Part I
All data is from even-strength situations
To test whether goaltenders forcing shooters to miss the net is a skill, a split-half analysis of odd and even games was used instead of year-to-year correlations. The rationale behind using this method is that if no skill exists, the correlation should essentially be zero between a goaltender’s even and odd games. This method is also an improvement over year-to-year correlations as it allows for a greater sample size. It also accounts for inconsistencies in counting missed shots from rink to rink, or home rink bias.
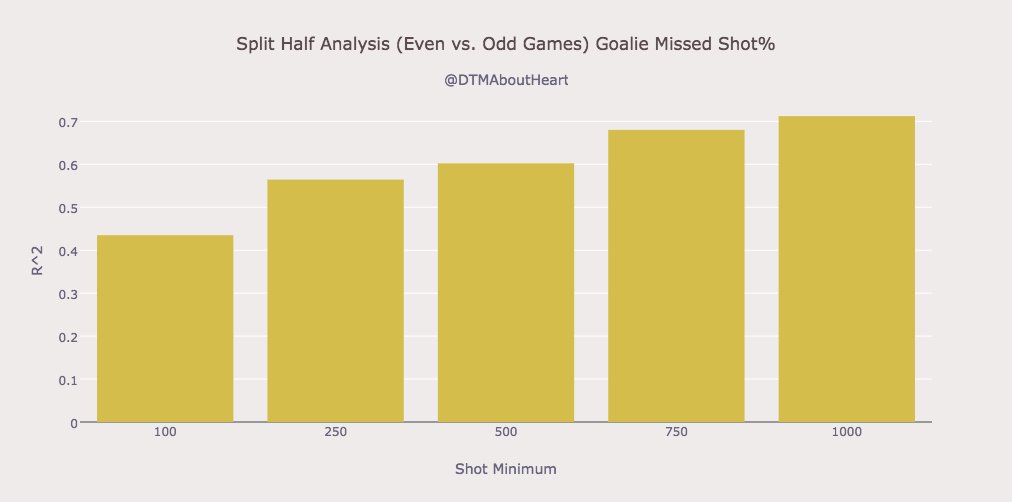
Figure 1
Figure 1 above shows a clear correlation between percentage of Fenwick shots that were misses in even games and percentage of Fenwick shots that were misses in odd games. These results form the basis that goaltenders forcing opponents to miss is a repeatable skill.
Part II
The focus will now be on a model-based approach to predict how many goals a goaltender is expected to concede. Since goaltenders face varying workloads, an adjustment for shot quality is necessary. The expected saves model presented below accounts for shot quality variables that were previously found be to predictive of scoring here. Accounting for shot quality allows for a better comparison of goaltenders by revealing the value a goaltender provides relative to an average-level goaltender facing a similar workload.
To calculate by how much a goaltender has under or outperformed his expectations, a goaltender’s expected Sv% (1) is subtracted from his observed (or actual) Fenwick Sv%. The resulting difference will be designated as xSV% (2).
The expected Sv% and xSV% formulas are shown as follows:
(1) expected Sv% = xGA / Fenwick Against
(2) xSV% = Fenwick sv% – expected Sv%
A positive xSV% result would indicate an above-average performance, while a negative value denotes a below-average performance. Similarly, a lower expected Sv% points to a relatively harder workload while a higher value indicates a relatively easier one.
Part III
An in/out-of-sample test is performed to test whether over/underperforming expectations is a repeatable skill. The test was conducted as follows:
- Select a random sample (1) of 10 games
- Select a second random sample (2) of 10 games not included in sample (1)
- Calculate xSV% for every goaltender in samples (1) and (2)
- Compute the correlation between samples (1) and (2)
- Repeat steps 1-4 250 times
- Use Fisher-Z Transformation to average the correlations
- Repeat steps 1-6 at 10-game intervals from 10 to 150
The same test was performed for raw Fenwick Sv%.
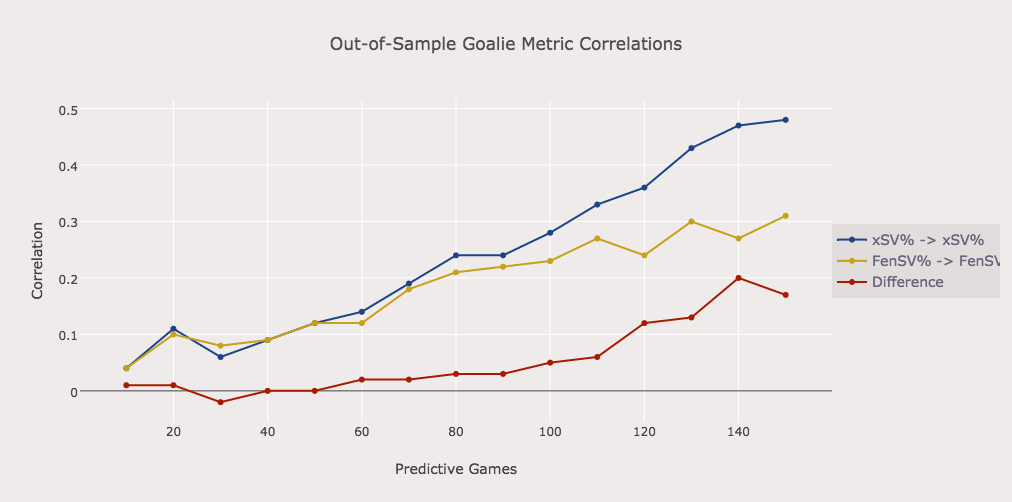
Figure 2
The Difference curve in Figure 2 shows that xSV% consistently outperforms raw Fenwick Sv% starting at the 50-game mark. Thus, over/underperforming expectations is more of a repeatable skill than simple Fenwick Sv%. Note that Fenwick Sv% is a better metric than standard Sv% (shots on goal only) since it accounts for a goaltender’s ability to force missed shots. To conclude, xSV% provides a better predictor of goaltender performance in comparison to Fenwick Sv%.
All data is included in the spreadsheets below:
Note: xGS is the added amount of goals a given goaltender has saved relative to a league-average goaltender having the same workload
Thank you to @war_on_ice for all the data used in this paper.
Please let us know if you have any questions, concerns and suggestions via twitter (@DTMAboutHeart, @asmae_t and @HockeyGraphs), e-mail (DTMAboutHeart@gmail.com) or in the comments below.

Nice work. I do think you do need to qualify your interpretation of your last graph tho, which shows xSV to basically be equal to fenwick sv through 50 games and barely better over a whole season. It’s not really consistently better – it just is equal until sample size is sufficiently large.
I guess it depends how you interpret the results. My thought process was that Figure 2 basically had a near similar look to when Tulsky proposed Even-Strength SV% instead of overall SV%, but yes that caveat is important. http://www.broadstreethockey.com/2012/1/25/2730816/goalie-save-percentage-projections-even-strength
I have more to read but one comment so far:
“These results form the basis that goaltenders forcing opponents to miss is a repeatable skill.”
Or it could be that team defense tactics forcing opponents to miss is a repeatable skill. I wonder if home arena bias might be a factor as well. To test if it is the goalie or the defense/arena bias you’d have to look at year over year correlations for goalies changing teams (which is a good idea anyway though sample size starts to get small).
I will add that if there is a team defense component in missed shot rate then that team component would trickle down into FenSv% and xSv% in which case those stats aren’t necessarily exclusively measuring goaltender ability.
Otherwise this is a good analysis and there is probably some value in xSv%. I’d just like to see more confirmation that some of the results you are seeing aren’t team influenced (and if so, to what degree). I would recommend looking at year to year correlations splitting out goalies that have switched teams to see if the correlations are maintained.