
Over the holidays, I created some charts that show the distribution and density of Shots and Scoring Chances for Per 60 for each team. There’s a lot of information in these charts, so I chose a few to inspect further.
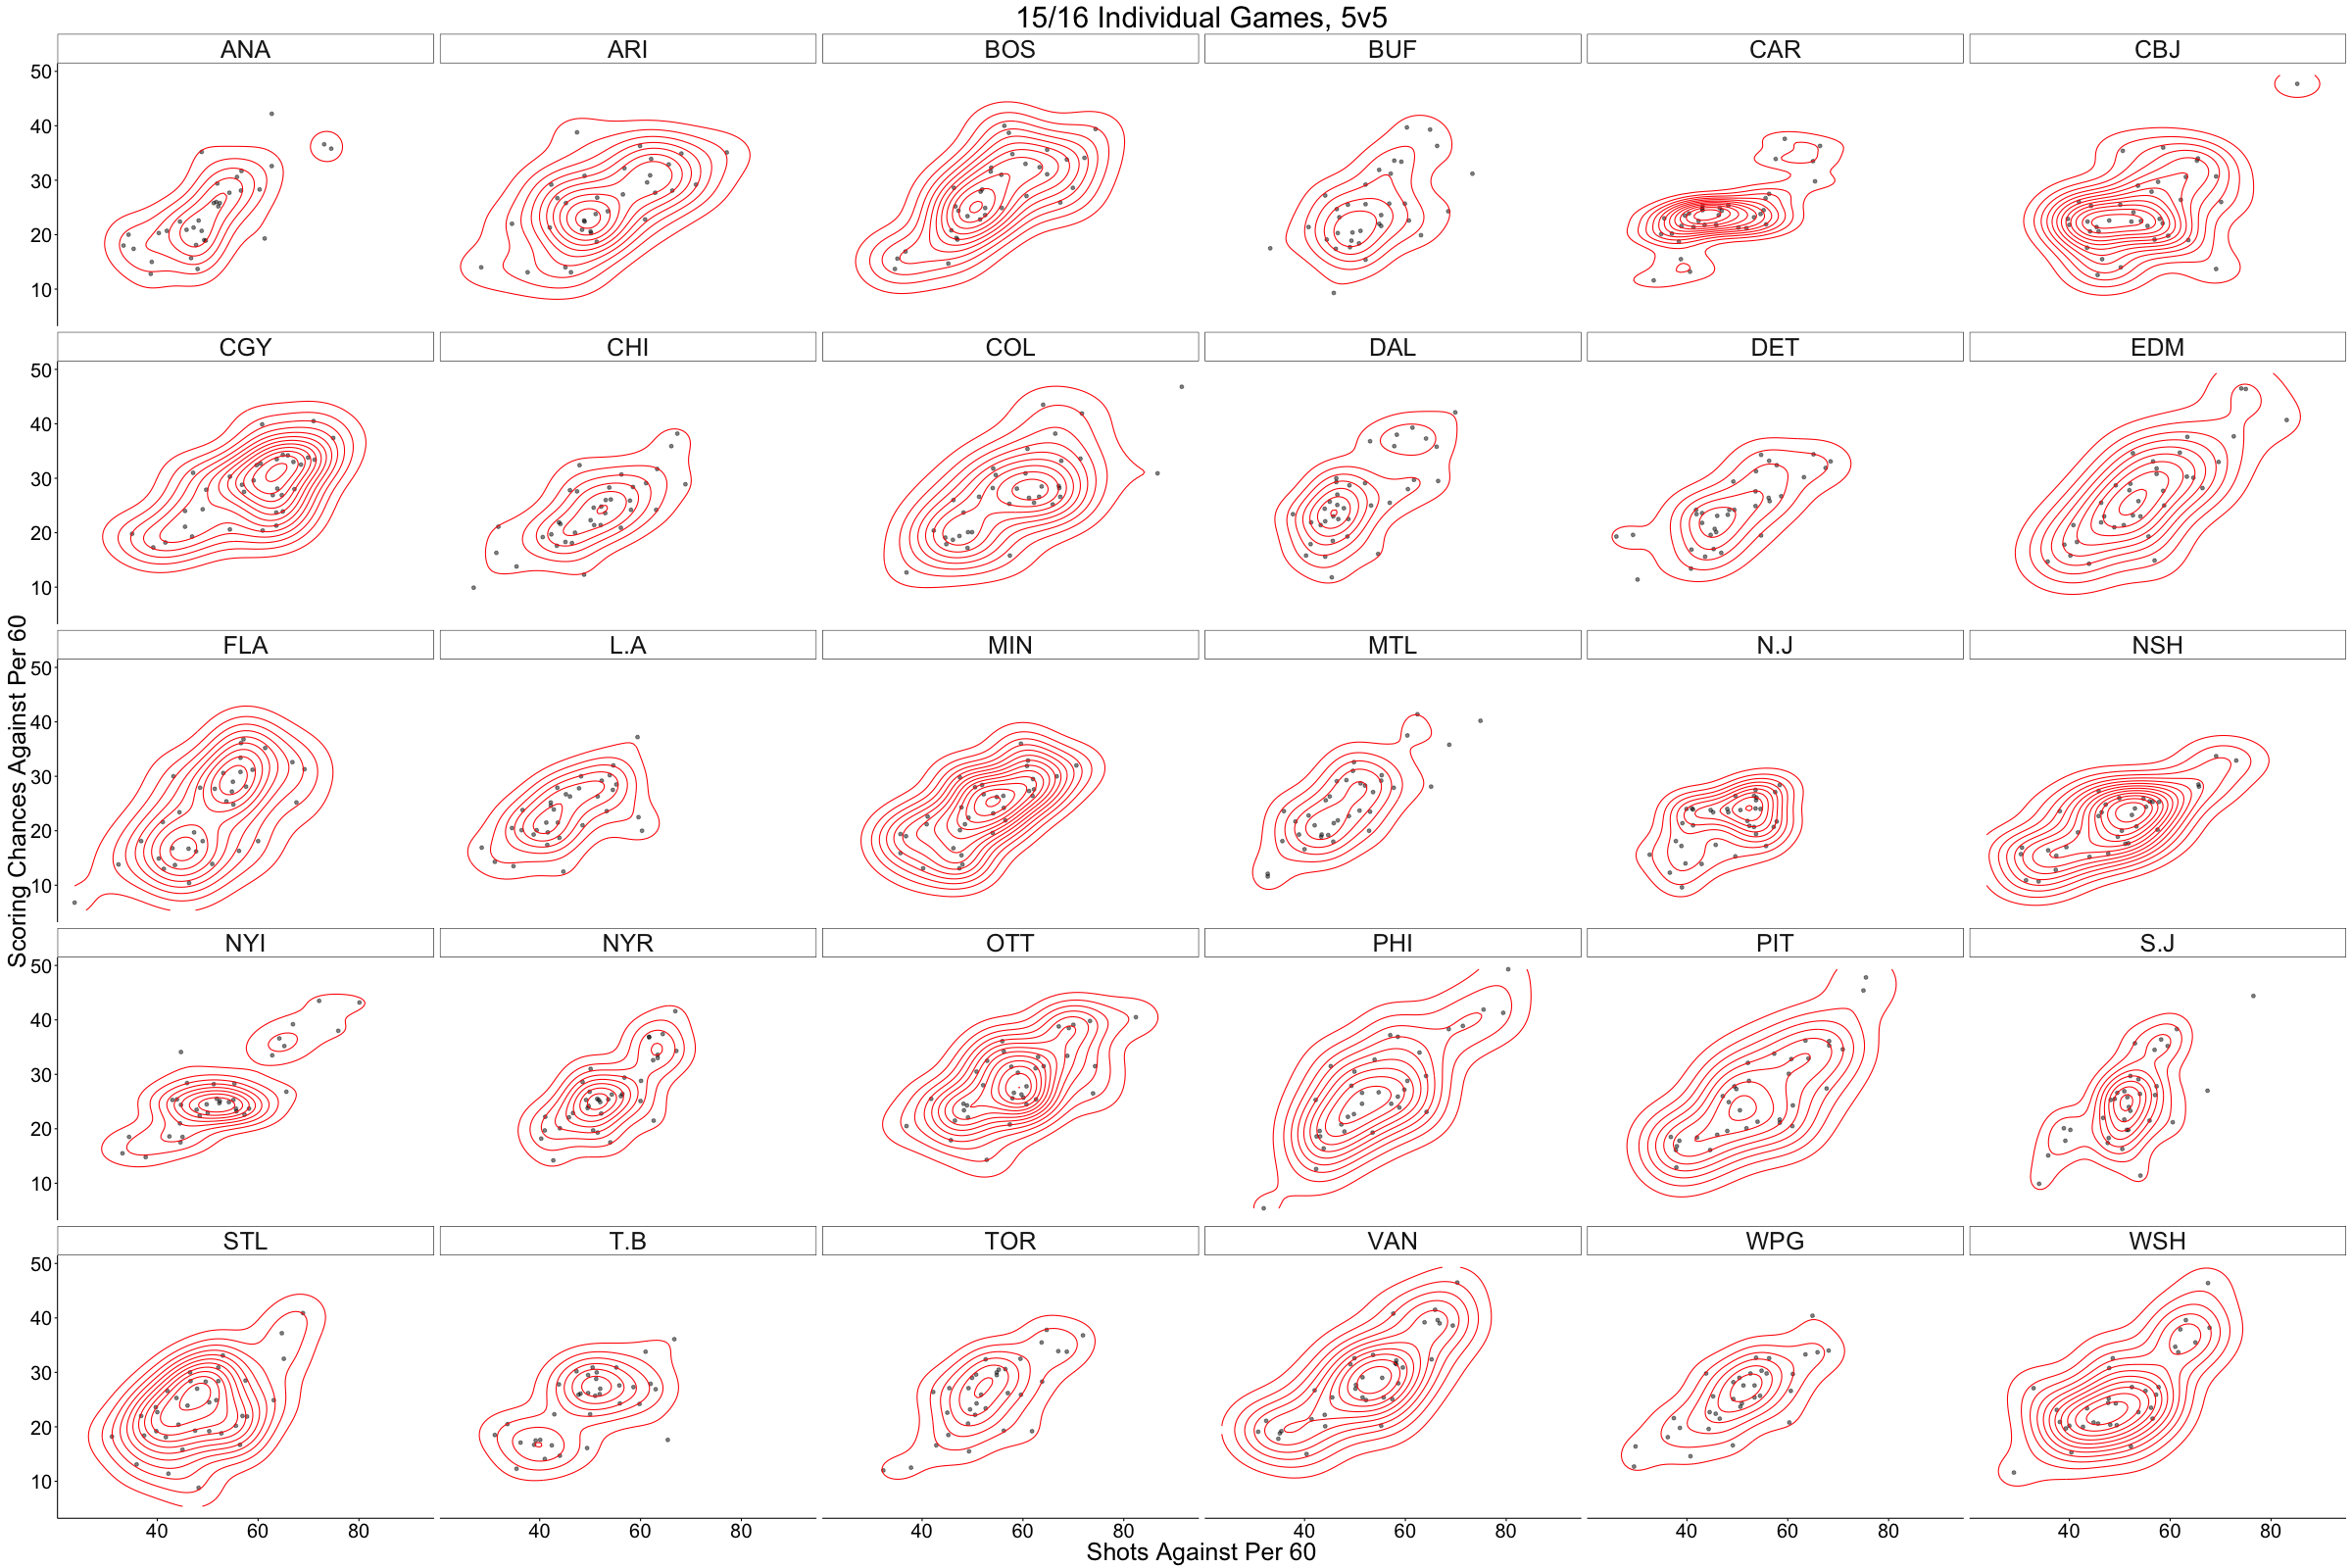
First, we’ll look at the league-wide chart for Shots and Scoring Chances For. Keep in mind that each individual dot is a game, and the contour lines show the density of the dots (i.e. how close they are to each other).
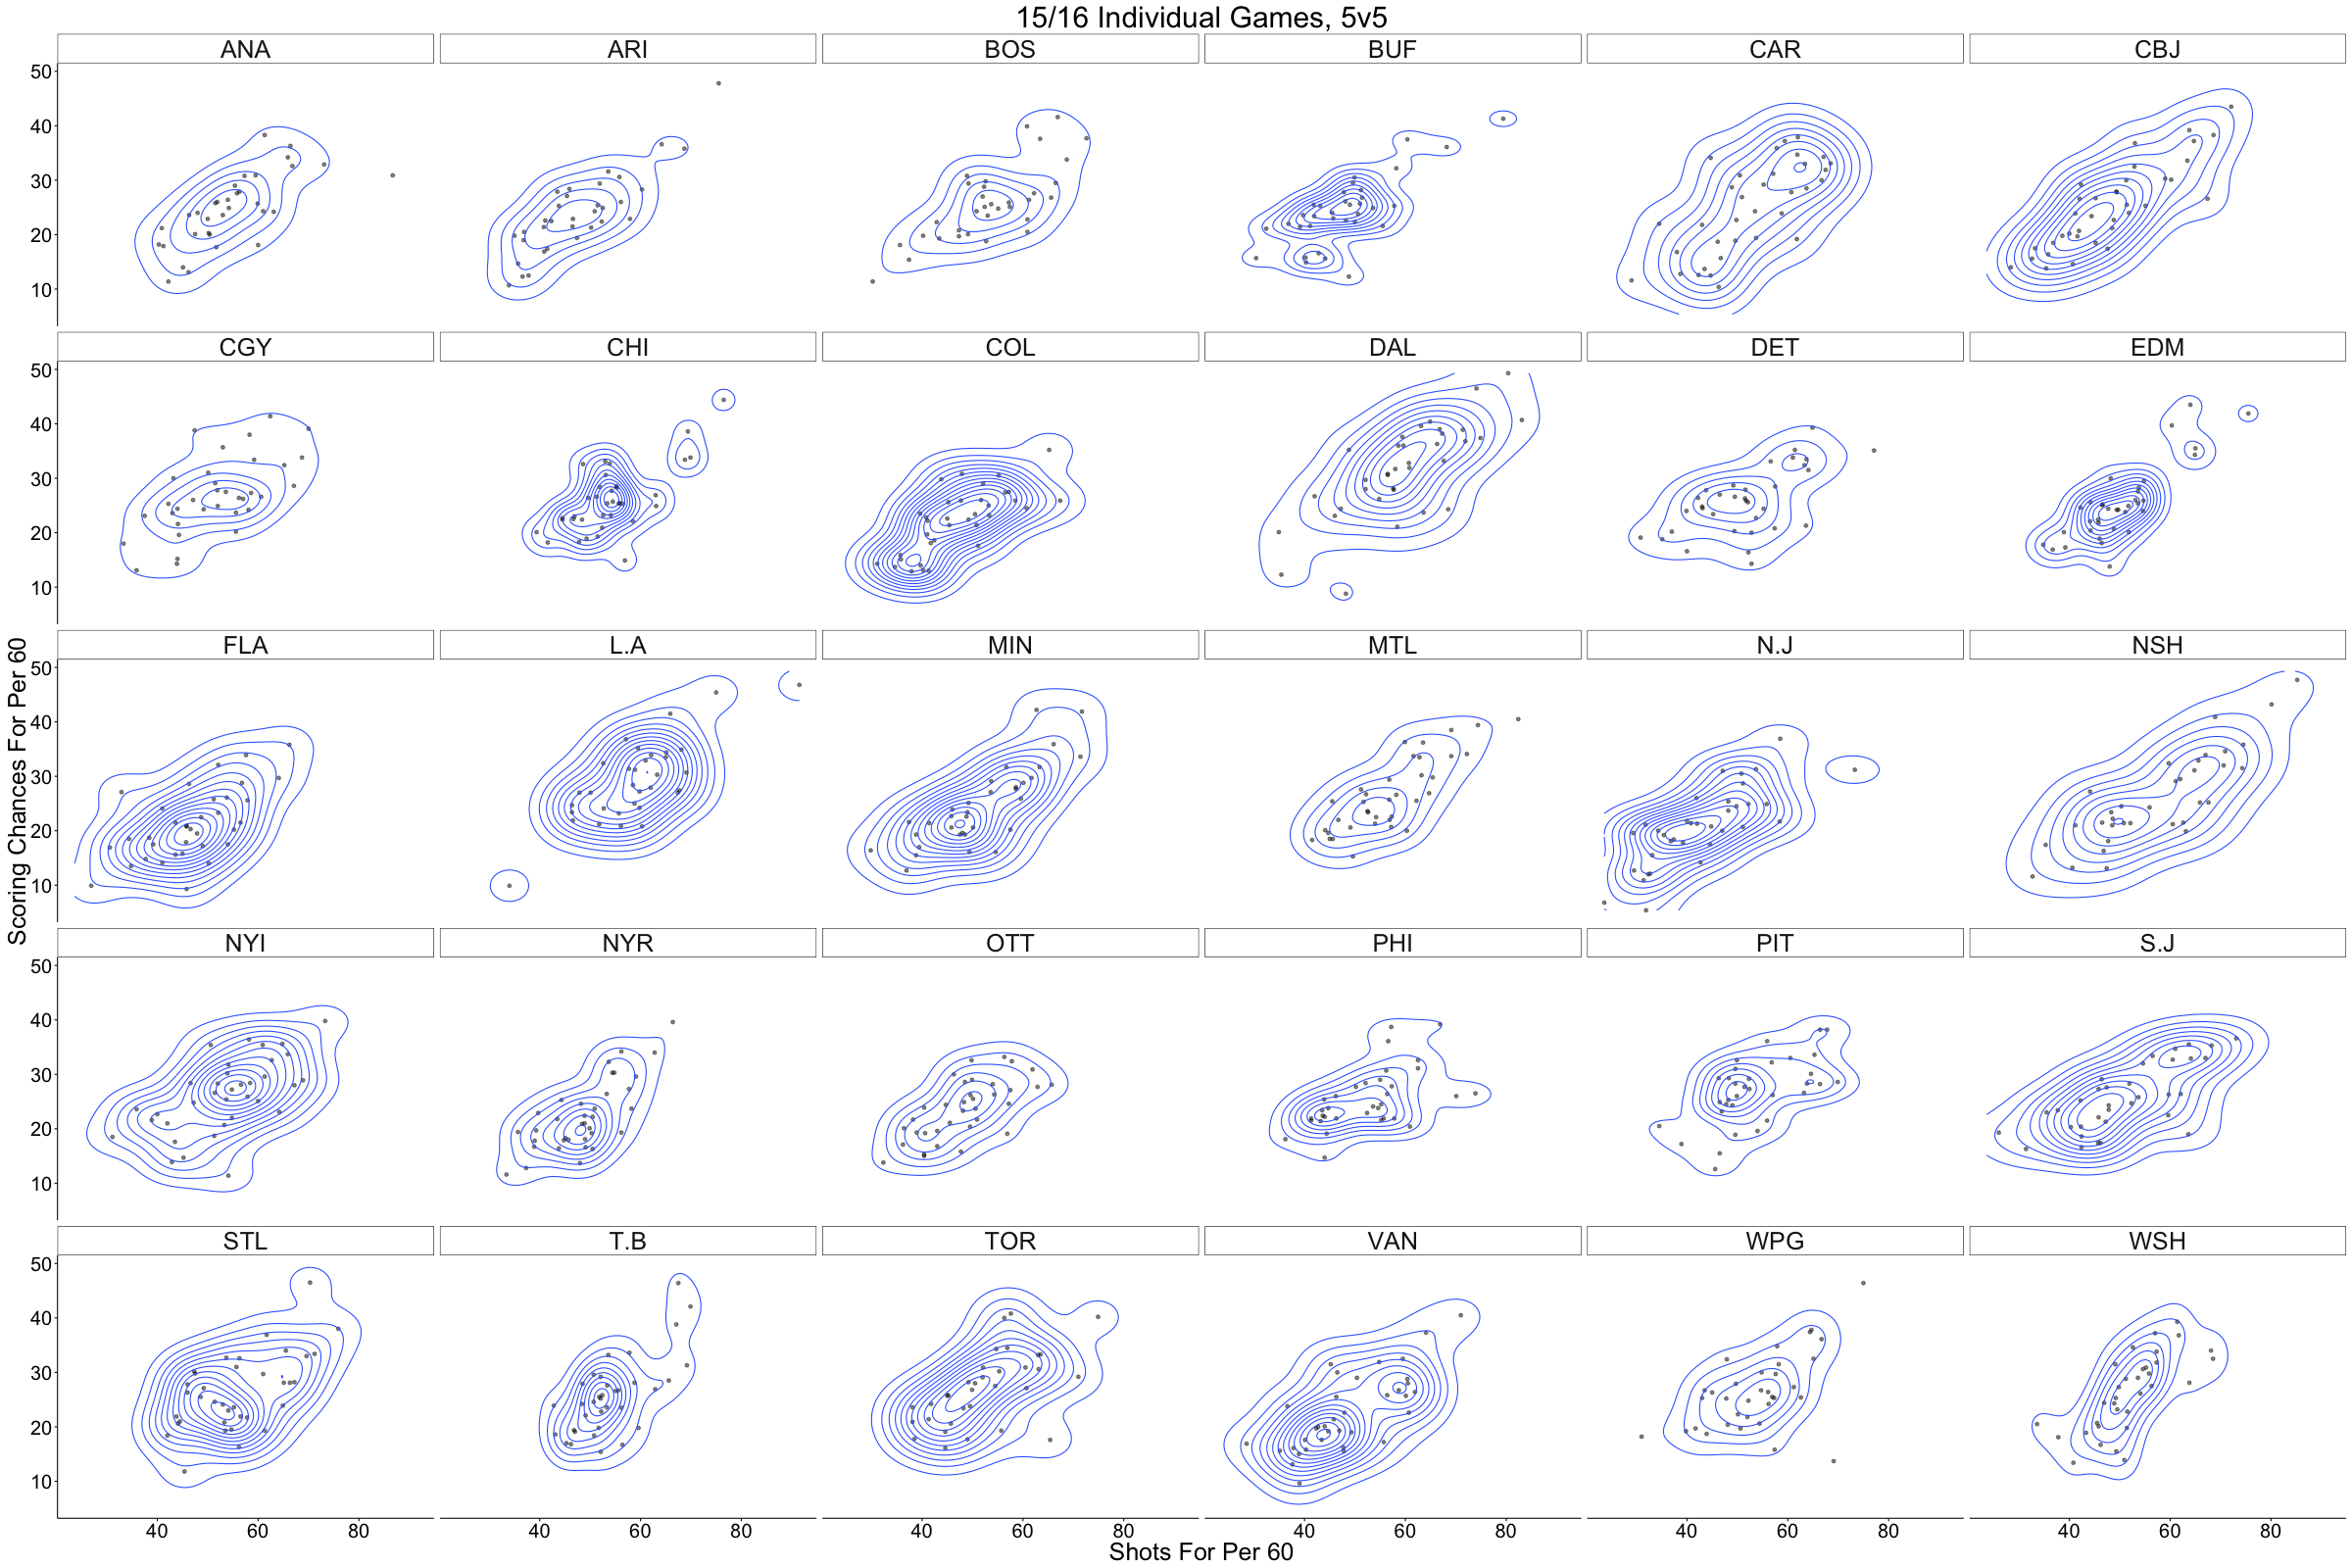
We can see that some teams are obviously better at generating shots and scoring chances than others. The density of the plots can tell us something about the consistency of team performances.
For example, Dallas creates many more scoring chances than most other teams.
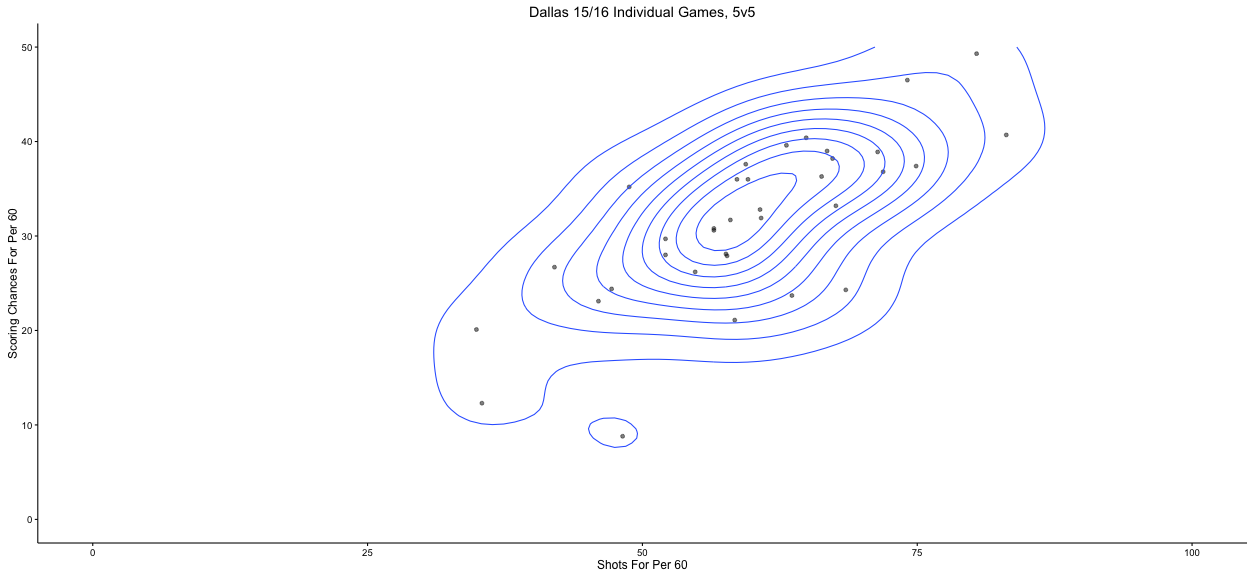
Their dots are not particularly dense, indicating a lack of consistency, but compared to the league their performances are clearly superior. Consistency in this instance may be overrated. Dallas has only had 2 games where they created less than 20 Scoring Chances Per 60.
Comparatively, New Jersey’s offense is much less prolific.
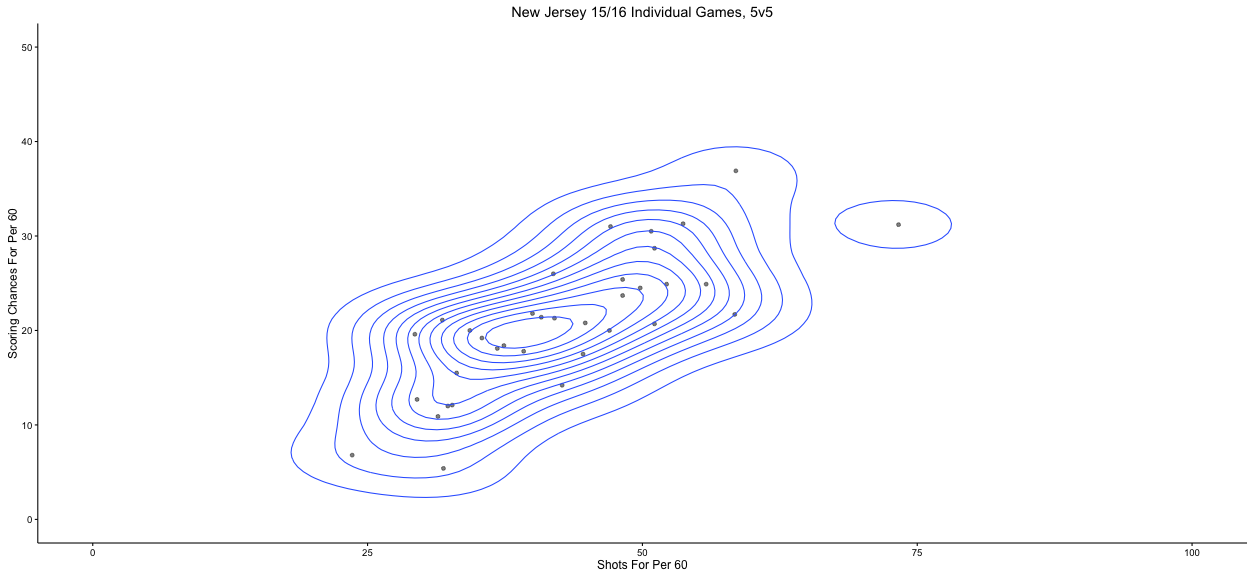
Their offense appears to average around 20 Scoring Chances Per 60. In other words, New Jersey’s average game is one of Dallas’ worst.
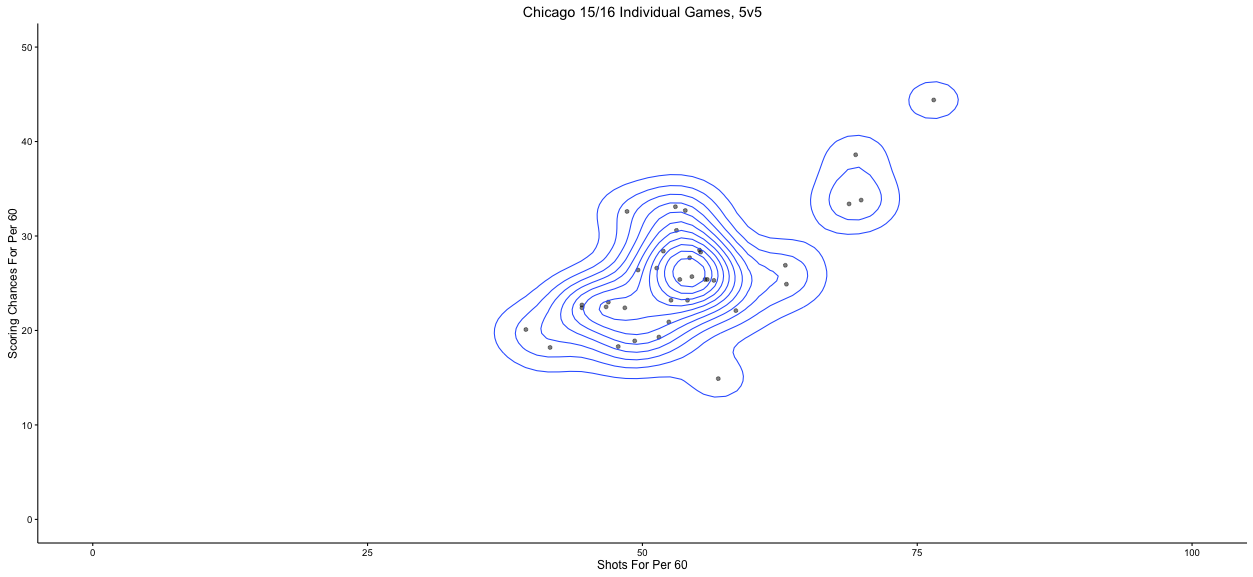
On the other hand, Chicago’s offense is much more consistent than that of Dallas or New Jersey.
Shots and Scoring Chances Against follow a similar pattern across the league.
There are definitely some curious graphs here. For example, Carolina:
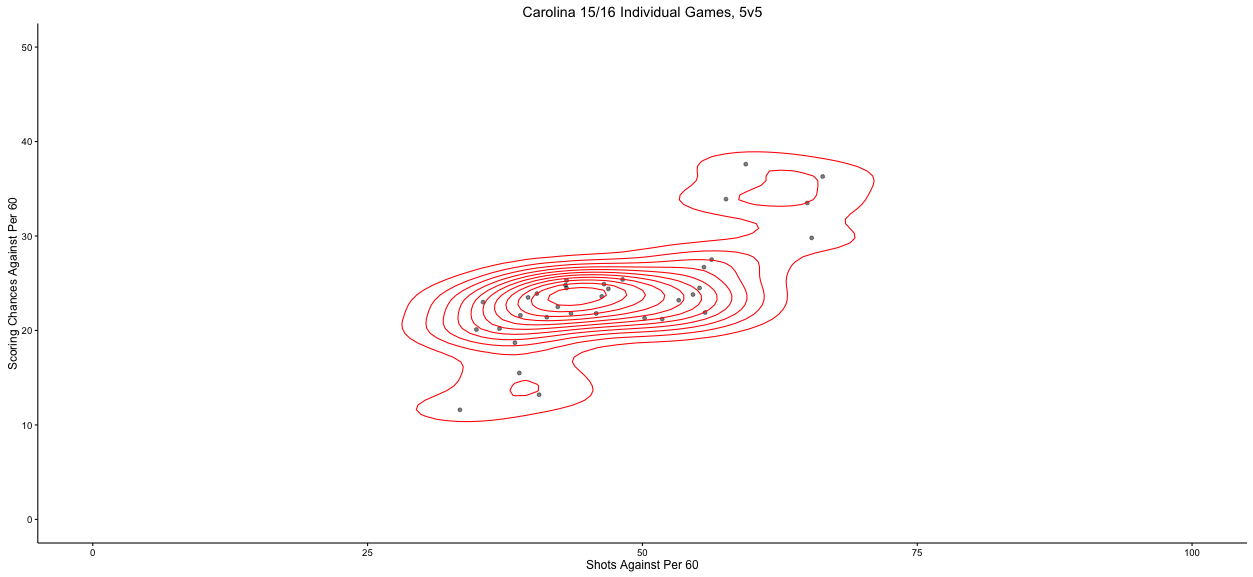
Carolina’s Shots Against Per 60 certainly varies along the x-axis, but there is a curious uniformity in their Scoring Chances Against Per 60. There are of course some outliers, but the contour lines show that most of their performances line up in a band around the low 20’s. Perhaps Peters has the team play in a system that suppresses the shot location quality of the opponents?
Vancouver, on the other hand, does not have any shot location quality suppression ability.
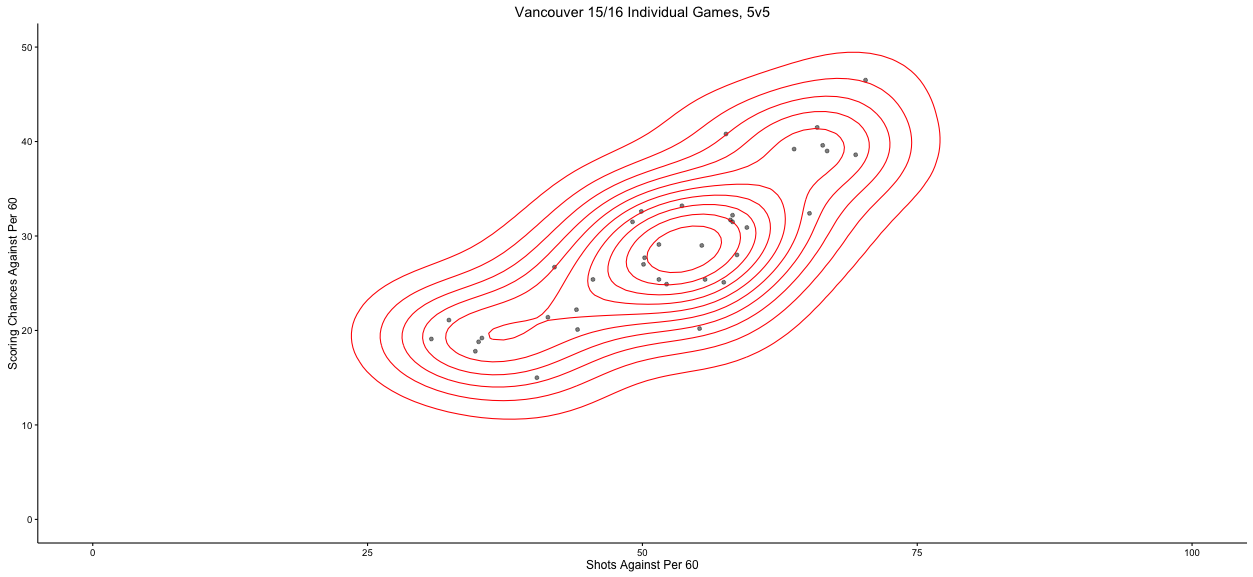
When Vancouver gives up shots, they are also giving up scoring chances. Unfortunately for Vancouver, they give up a lot of shots.
New Jersey has one of the most dense contours of any team defensively.
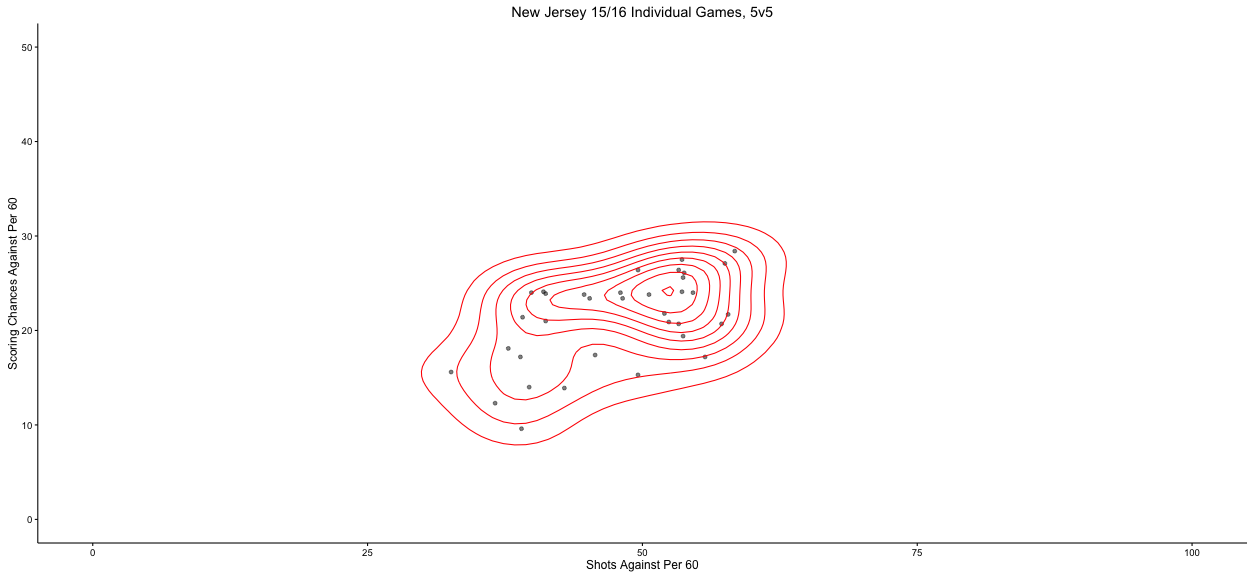
Even after changing management and the coaching staff, the Devils still manage to be one of the most consistently stifling defensive teams in the league.
Follow me on twitter @Null_HHockey

TERRIFIC!!THX