

This guy may be lying flat on his face like this more and more often as he’s reaching the big 35.
A few weeks back, I unveiled Hockey Marcels: an extremely simplistic system for projecting goalies performance going forward, utilizing just the last four years of a goalies’ play to do so. Building off of work by the great Eric T., I weighted more recent years more heavily than older ones, to try and give a better estimation to what we should expect from goalies going forward. In addition, I added a regression factor to Eric’s work, such that we could deal with varying sample sizes and the extreme variability of NHL goaltending.
But the one thing I didn’t include was an aging adjustment. This is an integral part of any serious projection system for the obvious reason: Using past years to project future data is sound, but players will be OLDER in the future and increased age generally results in worse performance (except for the really young). This is especially the case with hockey, where peak performance has been found to be at ages 24-25. If we really want to project goalie performance going forward, we need to find out how well goalies age.
A few people have looked at this before (both Eric and Steve Burtch have written about goalie aging in previous posts), but I wanted to actually get #s rather than just a graph on how aging affects goalies of all ages. So I used hockey reference to get the seasonal data of all goalies from 1996-1997 to the present season who had played 20 years, and tried to take a look.
Eric Tulsky has been using a method recently to evaluate aging of skaters that works like this: You look at a goalie’s performance at year 1, then at that SAME goalie’s performance at year 2. You then average that change with the change of other goalies from those same ages and this gives you an aging curve. It should be noted, that unlike skaters, there are a LOT fewer goalies in the NHL, so you don’t get great sample sizes over all ages. Hence why I’m going back nearly 20 seasons (Even with that, I can’t get any solid samples for goalies under 23 or goalies over 35 – you wind up with things like Dominik Hasek making goalies over 40 magically improve by a ton). However, this means that I have to adjust the save percentages involved at all points because league average goaltending has changed massively over the years. So the #s I’ll be using are performance changes relative to average. This gives you a graph that looks like this:

First of all, you’ll note that there’s a clear negative track here as you might expect: goalies get worse as they age, as we’d expect.
Second, you’ll notice that, blatant outliers notwithstanding, goalies DO NOT IMPROVE. Goalie performance is on average ALWAYS worse relative to average as they get older, even at young ages. Your lousy 25 year old goalie is not going to get better with experience – he’s just going to get worse.
So how does this graph track if we plot an aging curve with the data? Well:
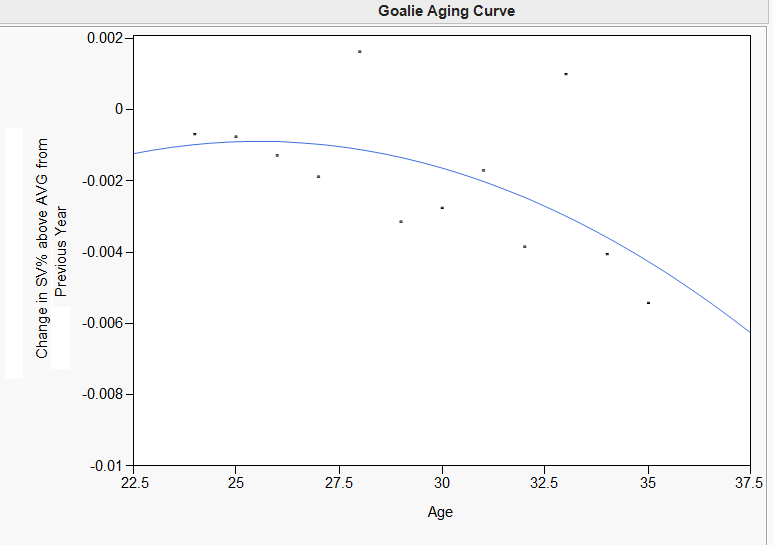
This curve looks reasonable in graph form, but it really predicts that goalies will fall off a cliff from age 35 on:
Change from 35 to 36 years old: -.005
Change from 36 to 37 years old: -.006
Change from 37 to 38 years old: -.007
Change from 38 to 39 years old: -.008
Change from 39 to 40 years old: -.009
In short, this type of curve extrapolates that a .920 (well above average) goalie at 35 will be at .909 in two years (quite below average) and .885 by age 40! It’s hard to know if this is true since we have so few goalies this old in the data set, but it is hard to believe that physical performance can drop off THAT much in a SINGLE year, even in the mid 30s.
But take a look at that first graph again. While we usually think of aging in terms of curves – since players tend to improve at first till they peak then decline thereafter – the goalie aging chart actually looks fairly linear (Credit to Brian Mills for noticing this)! So what about a fit like THIS instead:

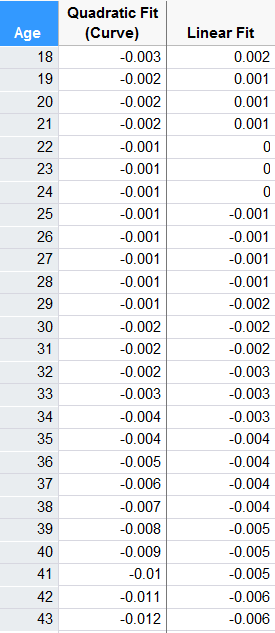
The fit here is slightly worse than the curve (the R^2 drops .04), but the gradual drop in goalie performance is a bit more believable toward later goalie ages than the quadratic fit. Now, the drop in performance relative to average looks like this:
Change from 35 to 36 years old: -.004
Change from 36 to 37 years old: -.004
Change from 37 to 38 years old: -.004
Change from 38 to 39 years old: -.005
Change from 39 to 40 years old: -.005
So now our 35 year old above average .920 goalie is basically just barely below average in two years at .912, and at age 40 is still horribly bad – .898, but isn’t gong to put up one of th e worst goalie seasons ever (these #s may look similar to that of say Martin Brodeur who at 40 is now around the .900 area)
Conclusion: I’m going to use the Linear aging curve going forward in my Hockey Marcels, but no matter which one you use a few points are still clear:
1. Goalies don’t improve as they get older
2. By age 30, goalie decline starts to get REALLY noticable
3. By mid-30s, even with the aging line, goalies rapidly start to fall apart.
With a few 27-32 year old goalies hitting free agency this year, teams should REALLY be careful how much and how long they pay guys who are hitting the roughest years in their careers.
Appendix: A full list of how the two fits describe goalie aging can be seen below:

Brilliant!
Out of curiosity, how many goalies total did you include in your statistics? I’m sure it’s a relatively small sample size, given that you’re only looking over ~15 years and including only goalies who have played 20 years or more. I’m just wondering how that affects the predictability of an aging curve for NHL goalies…
The sample size was from roughly 40-50 goalies from ages 25-34, and the curve above also uses the 27 goalie sample at age 35 and a 31 goalie sample at age 24. Over 800 seasons and this is how small our samples are of goalies who played consecutive seasons (lockouts didn’t help this study).
The results match previous ones, so I find it fairly convincing. (The R^2 was about as high as I could’ve hoped for on one of these.)
Based on all the work you’ve done projecting goalie performance who do you think the Islanders should get next season and what save percentage does your model predict for them?
I’ll be doing a post on that for LHHockey after the season is over. I’ll also be running updated Marcel projections after the season, now including the aging adjustment.
In short, the Isles need two goalies, so it depends on the market. Halak is almost certainly going to have the best projections of any FA goalie.
It’s generally best to use the simplest regression possible, so without any a priori reason to use a quadratic form, it’s probably best to use a linear regression.
Well, we have a pretty good priori reason – aging curves tend to be curves for the logical reason: people get better, more strong and skilled, up till a point and then decline thereafter, with the decline compounding as you get older. So we should expect a curve unless proven differently.
It would seem likely that the low number of opportunities available for goalies should affect the early part of the curve since it is very difficult for a young goalie yo break through to full time starter position, thus distorting the data (only the most promising goalies are represented from that age group, “easier” to maintain high average numbers over less games played by backup.
The method used here should avoid selection bias since it tracks average change in individual goalie performance, not the average change in the group.
And there’s no reason to think aging should affect backups more than starters
12 years later but this is still a very high Google result for goalie aging, so:
“it tracks average change in individual goalie performance, not the average change in the group.”
Someone didn’t read the whole article…
“You look at a goalie’s performance at year 1, then at that SAME goalie’s performance at year 2. You then average that change with the change of other goalies from those same ages and this gives you an aging curve.”
Just to name one problem here: OP’s conclusions rest on the premise that on average goalies will face equivalent quality of competition in every stage of their career, which makes the conclusions literally worthless.
It seems very odd to think there is no benefit to NHL experience at goaltending, unlike forward or defence.
on the contrary. More experience means teams have more footage to find a goalie’s weakness(es).
You seem to have a good understanding of sampling and regression, but you don’t know how to make sense of a linear trend. Your process makes sense, your conclusions are silly.
your comment on linearity vs curve is kind of funny. when you regress the change linearly, you are actually still describing a parabolic function of goalie ability. since your y axis is the percentage change in save%, you are basically plotting the derivative! and the integral of a linear function is a parabolic one