Trading Off: How Much Possession Can My Team Surrender and Still Win?

Photo by Michael Miller, via Wikimedia Commons; altered by author

Photo by Michael Miller, via Wikimedia Commons; altered by author

Within the continuing discussions over the value of possession metrics, and the veracity of shot quality or shooting talent measures, there’s a point that seems to have slipped through the cracks. While there’s a spectrum of attitudes about possession and shot quality/talent, neither entirely refutes the importance of the other – and with that thinking, it’s worth considering how much you can sacrifice in one and still maintain success by the other. Put more simply, how little can a team possess the puck and still expect to shoot their way to success?
Continue reading

2014-15 NHL Season Preview: The Pacific Division

Photo by "Kaz Andrew", via Wikimedia Commons

Photo by Kaz Andrew, via Wikimedia Commons

Whenever I put together something as broad as a division preview, especially since the divisions have expanded, I usually try to slap something together that helps me get a quick impression of the teams as compared to one another. This time around, I put a little work into generating a 5v5 simulation of this coming season, specifically among the projected top 6 forwards, top 4 defensemen, and goaltenders. As 5v5 play comprises a little over 80% of all NHL gameplay, and these players tend to more consistently drive results (as players of around 3/5 to 2/3 of gameplay), focusing on their 5v5 performances from last year bring us to use a bit more stable indicators of future team performance. The quick-and-dirty approach here benefits from the fact that most of the Pacific lineups are quite similar from last year, and the top 6 and top 4 players tend to be deployed in the same roles from year to year. So, I took the average 5v5 Corsi-For% of the entire of the top 6 and top 4 for each team, the average 5v5 shooting percentage of the same group (for Johnny Gaudreau, I assumed a forward league-average 9%), and the career 5v5 save percentage of the projected goaltenders (for Fredrik Andersen I assumed a goaltender league-average 92.1%), and ended up with a projected 5v5 season that looked like this:
Continue reading

Gordie Howe vs. Bobby Orr vs. Wayne Gretzky vs. Sidney Crosby: Not Your Typical WOWY

Photo by "Djcz", via Wikimedia Commons

Photo by “Djcz”, via Wikimedia Commons

With or Without You analysis, often referred to as WOWY, frequently involves either comparing the performance of a team or particular players when a single player is and isn’t playing. While the approach is a risky one (sample size is a pretty big issue), it can actually be quite telling when you collect enough data.

The value of modern WOWY is that you can definitely get data from precisely the seconds a player played apart from the seconds they weren’t on the ice. Historical WOWY, on the other hand, cannot do much better than taking data from games a player played versus games they didn’t. To this end, then, I wanted to see if historical WOWY can tell us much of anything, and the best way to do that is to focus on players that are undisputed in their value. In this case, I went for WOWYs of the big guns, four of the best players across the eras of NHL history: Gordie Howe, Bobby Orr, Wayne Gretzky, Sidney Crosby.
Continue reading

Using NHL Coaching Changes to Identify Historically Good and Bad Coaches

Iron Mike no like. - Photo by "Resolute", via Wikimedia Commons; altered by author

Photo by “Resolute”, via Wikimedia Commons; altered by author

Having now looked at the overall effect a coaching change might have on a team, and identified some outstanding examples where a coaching change had a drastic impact on a team, it’s now time to shift over to some juicier matters. For the most part, I don’t think one coaching change is necessarily sufficient to say a coach is good or bad; there is a possibility the previous coach was just that bad. But if the coach returns the same signal a couple of times or more, you are probably getting closer to a true reading on what they might bring to the table.

Across the 140 or so coaching changes these last 60 years where both coaches led the team 20+ games, there were 69 coaches who were a part of that change twice or more (which, to me, is quite a remarkable number). The full list, followed by an explanation of the measures:
Continue reading

Where NHL Coaching Changes Did, and Didn’t, Help Their Teams

If you or anyone you know have seen this man behind your player, contact the front office immediately.  (Photo by "Dan4th Nicholas", via Wikimedia Commons; altered by author)

Photo by “Dan4th Nicholas”, via Wikimedia Commons; altered by author

Michel Therrien has an interesting distinction in the research I’ve been doing about NHL coaching changes: he’s given me 4 instances where he and his replacement have coached 20+ games within the same season. He’s also replaced or been replaced in three of those instances by legit coaching talent – he replaced Alain Vigneault for the Montreal Canadiens in 2000-01, was replaced two years later by Claude Julien, and lastly was fired in favor of Dan Bylsma for Pittsburgh in 2008-09. What’s incredible about these three cases is that, in every single one of them, there was a drastic change in outcomes for the teams involved. Using 2pS%, or possession measured by two-period shots-for divided by two-period shots-for and against together, the numbers tell a story:
Continue reading

What to Expect When You’re Expecting: Does Switching NHL Head Coaches Make a Difference?

Bruce Boudreau

Photo by Matthew Miller, via Wikimedia Commons; altered by author

How good do you feel because your team has a new coach? I mean, really…it’s almost like a new-car smell. So many possibilities – This time, things will be different. With the exception of coaching changes due to disastrous, unexpected things, the typical hockey fan was ready for that moment, and were happy to see the coach go. But is that eagerness for change based on real results?

Continue reading

The Hartnell for Umberger + 4th Rounder Swap, and the Places a Bad Contract Puts You

File:Scott Hartnell 2010-10-30a.jpg

Photo by “Rhys A.” via Wikimedia Commons

I had a great question from a good friend of mine, a Flyers fan, after the fervor died down from yesterday’s Scott Hartnell for R.J. Umberger and 4th round pick swap. He asked me:

“From what I’m getting from the advanced stats guys, it appears that the Blue Jackets robbed the Flyers blind yesterday by getting Hartnell for Umberger (a guy they were going to compliance buyout anyhow).

Is Umberger really this bad?”

The short answer is that Umberger is not very good; his With-or-Without-Yous (or WOWYs; where you compare Corsi when a player is with and without a teammate on the ice) suggest that nobody plays better with him than others, outside of maybe Ryan Johansen. Now, some of that is due to zone starts, as Umberger has been saddled with a lot of time in his own zone. Even so, three years of possession in your end 55%+ of the time is a little too consistent in its futility. I’d expect at least one year there where that figure lowered to 51 or 52% if he was showing some defensive abilities. He’s still an average player in the faceoff dot, but his offensive contributions are shrinking, and at 32 it’s hard to see them recovering much. Blue Jackets beat reporter Aaron Portzline noted the Jackets were contemplating buying him out of his $4.6m/year cap hit contract, which was moving into modified no-trade clause (NTC; player can specify a list of teams he’d be willing to be traded to) years.

The longer answer is that yes, Umberger is not good, but this trade is much more complicated than a player-for-player, or player-for-player-and-a-pick swap. A trade presumably always looks good enough from both sides’ perspectives in order to happen, so what were the incentives for Ron Hextall? Jarmo Kekalainen?

Continue reading

Revisiting the NHL Regression Predictions from January 1st

Photo by “User:Zucc63” via Wikimedia Commons, modified by author

If you’ll remember, one of the inaugural posts here was a regression prediction piece, using a combination of PDO and Fenwick Close to see who might improve or decline over the latter half of the season. I decided to put together a table of the teams I predicted would negatively or positively regress, just using the aforementioned data:

If you’ll remember, I pegged Anaheim, Colorado, Montreal, Phoenix, Toronto, and Washington for negative regression, and Florida and New Jersey for positive regression. So, even with really rudimentary predictors, this season I was able to be fairly successful building predictions from a half-season sample for the remaining season. In previous years, the fancy stats folks usually picked the much more obvious targets (Toronto being the big one this year), but it’s very possible to go further if you wanted.

Friday Quick Graph: NHL 5v5 TOI Peak at 24, 25 Years Old

This is the distribution of the skater performances w/200+ 5v5 TOI from the seasons 2007-08 through 2011-12 (n = 3,334). Use as reference for the below two charts. Notice that our line gets a little wacky as our n drops near the tails.

Some of you already know this, but I enjoy distributions, and I think they get sorely under-used in analysis (although, in the end, they are the basis of predictive work). This piece is a bit old (the data is across all skaters, 2007-08 through 2011-12, n = 3,334), but it shows the number of skaters with 200+ minutes of 5v5 time at each age grouping. The peak is clearly at 24 or 25 among this group, but we should be clear with what “peak” means. Although even-strength time can be a pretty good indicator of overall player talent, it’s still a shaky signal (c’mon, we know not all coaches put the “right” guys out there sometimes). Further, powerplay time can sometimes be a drag on better players’ energy for even-strength time, which can also compromise this signal. Nevertheless, if you were to sort all players into even-strength time groupings (say, forwards in 4 groups by ESTOI, and defensemen in 3 groups by ESTOI) you’d see that the top would generally perform better possession and offense-wise than the second, and so on down.

With that in mind, “peak” is also about health. Though we’ve not had much research into it (hint, hint), we have reason to suspect that injuries might drag on possession measures a bit. That said, 24-25 can also be a performance peak for the reason that players are less likely to have major injuries until that age or later.

I plan on digging into this data again (now that I have my ES data back to 1997-98) and splitting into forward and defense groups, but this is a good start.

The Day David Staples Killed Corsi Because…Taylor Hall

File:Taylor Hall.JPG

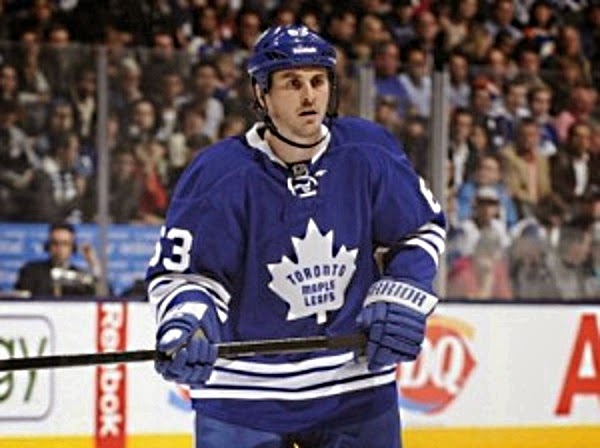
Photo by Alexiaxx, via Wikimedia Commons

I’ve been following the story of Taylor Hall as the season progresses, particularly through Tyler Dellow’s attempts to un-vex the vexing year Hall is having (Parts IIIIIIIV). In Tyler’s second part, he notes three differences between this year and last year: fewer zone entries with a carry, poorer retrieval of dump-ins, and a lower shots-per-carry total. The latter, Tyler notes, is likely symptomatic of a larger emphasis on dumping-in, wherein a player carries to just inside the blue line before dumping. He quotes Dallas Eakins as suggesting that Hall, in-particular, seems to take this dumping-in approach to heart. I’d add that there’s a possibility that this is abbreviating potential offensive zone possession time, as overall Hall and the other Edmonton Oilers have dropped from nearly 50 seconds per shift to 47 seconds. Further to that point, Tyler noticed in the fourth part that the Oilers have seemed to adopt a tip-in dump-in, wherein the player in the neutral zone either redirects or chips, while standing in place, the puck into the offensive zone. Just based on the video evidence Tyler provided, this looks like an extraordinarily passive approach to the dump, equivalent to dumping and getting off the ice. In that latter scenario, you are unequivocally giving up possession. In the tip-in approach, you take your active close player and leave them in-place, in favor of a later-to-the-game forechecker. It would seem to me that you’d benefit from an active dump-and-chase forechecker.

There are a couple of others irons you can put in the fire, including variance of CF% (a 5% swing is not unheard-of, particularly moving from a 48 to a 56-game sample), potential fatigue from increased playing time (he’s taken on some penalty kill minutes and more even-strength minutes this year), and the swapping out of Ales Hemsky as a linemate (for Sam Gagner). The tougher competition, for me, is essentially washed out by a bump up in offensive zone starts. I don’t see evidence of recording bias, either. I suspect a couple potential, additional things: 1) the drop-off is right there with the Ovechkin-Dale Hunter drop-off, so there might be some player vs. system aggravation, and 2) some fatigue issues related to the early-season knee injury. Injuries aren’t just about pain, they can also compromise strength and endurance. A guy like him, who has had injury issues in the past, does not want the “soft” label (you’ve seen what that’s done to Hemsky’s time in Edmonton), and might not want to admit it to the media or himself.

Up to this point, you’ve seen Dellow’s and my own introspection into what appears to be a poor possession season from Taylor Hall. Enter David Staples.

Continue reading