

(Image courtesy of Wikimedia)
Welcome to a brand-new, semi-regular segment where I -Garret Hohl- will touch on a few trending topics in hockey statistics in a less mathematical and more discussion format.
This week we will explore the debate on shot quality impacts on save percentage.
So let’s begin.
One item right off the bat: save percentage is not a team stat… at least not yet.
Save percentage is very likely impacted by the environment a player is in, as ALL hockey statistics are, but that does not prevent the statistic from being useful in player evaluation.
Alexander Ovechkin is one of the best goal scorers in the league, if not the best. You put Ovechkin on a great team filled with top-of-the-line players and he will score a lot more goals than if you placed him on a team consisting of Tanner Glass’ and John Scott’s talent levels.
This does not mean that an individual’s goal scoring is a team statistic.
A team having an impact on a number does not mean it’s a team statistic. The question to pose is how much do each impact the number?
How much is the goaltender? How much is the team?
These are the questions studies like Chris Boyle’s Shot Quality Project and Steve Valiquette’s Royal Road are trying to answer.
So far, they have shown that not all shots are created equal.
This should surprise no one. This has been known and looked at since the start of hockey statistical blogging (and prior). Scoring chances were been tracked prior to the use of Corsi.
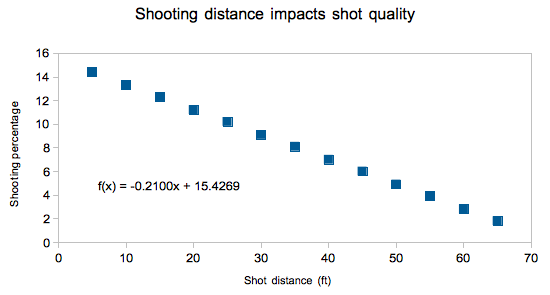
Shot location showed that shots closer to the net are more likely to score is just one of many examples on how data can be split to show different probabilities.
(Data courtesy of Ben Wendorf)
Despite all shots not being equal in probability and years of research, shot location has yet to improve upon save percentage in any significant manner for predicting future success. By distance, situation, or location, the evidence has not been there yet.
Like it or not, a high save percentage is the ultimate goal for a netminder. Their job is to prevent shots on goal turning into goals against.
While a goaltender does have some impact on shot differentials through puck and rebound control, ultimately the major impact on goal differentials and how a goalie drives wins for their team.
Save percentage has a positive correlation with wins.
Long term save percentage success predicts future success.
Save percentage in many ways is analogous to goal differentials for a player (not to be confused with traditional plus/minus, a flawed goal differential derivative).
It correlates to wins. In small sample it is hugely impacted by variance and near-random, making it difficult to use.
In the end though it is the final target. The game is about out scoring the opponent after all, and if a goaltender is to have any substantial impact on goal differentials it is through pushing the needle in save percentage.
The issue is that save percentage does not have underlying metrics like goal differentials do with shot differentials.
Maybe Boyle’s and Valiquette’s work will eventually lead to that, but not yet.
They will need to answer questions like:
We know teams and goalies can face different type of shots and that can impact the results in the short run. However, all evidence thus far shows that in time these differences in distributions are small in the long run.
If save percentage is to be limited to team analysis only, they will need to show that teams can significantly (in the statistical sense of the word) and sustainably control save percentage and the environments that caused the change.
Save percentage is flawed, as it needs large samples to begin to represent talent levels. This does not mean it is a team statistic, although it does mean that one should be wary when subdividing the highly variance influenced data.
