

“Jackets-Canucks Face-off” by Leech44 – Own work. Licensed under CC BY-SA 3.0 via Wikimedia Commons.
A debate was ongoing on twitter over faceoffs and their value. The debate lead to most of this data being scraped anyways, so I thought I would display everything for your viewing pleasure.
The truth is, faceoffs tend to be highly overrated. They matter, but they do not matter on average much more than any other of the many puck battles that occur throughout the game. When you really break it down, faceoffs are really just a set play puck battle after all. However, some have more values than others.
Let’s take a look.
Using data originally brought up by Gabriel Desjardins, I took the average estimated goal impact of player’s faceoff differential in each zone for even strength situations.
Here is the value for the top 100 faceoff takers (in terms of number of faceoffs taken):
| Player | DZ GV | OZ GV | NZ GV | Total |
| Boyd Gordon | 3.43 | 0.56 | 0.34 | 4.34 |
| Patrice Bergeron | 2.18 | 0.98 | 1.11 | 4.27 |
| Manny Malhotra | 2.18 | 0.88 | 0.20 | 3.26 |
| Paul Gaustad | 2.38 | 0.22 | 0.59 | 3.19 |
| Antoine Vermette | 1.30 | 1.15 | 0.46 | 2.91 |
| Vladimir Sobotka | 0.98 | 1.05 | 0.65 | 2.68 |
| Jonathan Toews | 0.98 | 1.15 | 0.55 | 2.68 |
| Jordan Staal | 0.81 | 1.15 | 0.36 | 2.32 |
| Jarret Stoll | 1.27 | 0.61 | 0.41 | 2.30 |
| Brad Richardson | 1.35 | 0.49 | 0.32 | 2.15 |
| Joe Pavelski | 1.10 | 0.86 | 0.16 | 2.12 |
| Jay McClement | 1.10 | 0.49 | 0.38 | 1.97 |
| Anze Kopitar | 1.72 | 0.15 | 0.04 | 1.90 |
| Matt Cullen | 1.30 | 0.54 | 0.04 | 1.87 |
| Travis Zajac | 0.96 | 0.27 | 0.64 | 1.86 |
| Claude Giroux | 1.57 | 0.39 | -0.15 | 1.81 |
| Marcel Goc | 1.37 | -0.05 | 0.39 | 1.71 |
| Mikko Koivu | 0.00 | 1.40 | 0.18 | 1.58 |
| Jason Spezza | 1.00 | 0.34 | 0.22 | 1.56 |
| Vernon Fiddler | 1.15 | 0.07 | 0.26 | 1.49 |
| Dominic Moore | 0.96 | 0.17 | 0.25 | 1.38 |
| Steve Ott | 0.49 | 0.69 | 0.17 | 1.35 |
| Marcus Kruger | 0.78 | -0.05 | 0.59 | 1.32 |
| Joe Thornton | 0.44 | 0.42 | 0.46 | 1.32 |
| Martin Hanzal | 0.56 | 0.39 | 0.31 | 1.26 |
| Ryan Johansen | 1.08 | -0.27 | 0.15 | 0.96 |
| Eric Staal | 0.07 | 0.76 | 0.11 | 0.94 |
| Mike Richards | 0.25 | 0.49 | 0.16 | 0.90 |
| Brandon Dubinsky | 0.17 | 0.25 | 0.44 | 0.86 |
| Zack Smith | -0.12 | 0.42 | 0.49 | 0.78 |
| Ryan Kesler | 0.15 | 0.07 | 0.56 | 0.78 |
| Andrew Desjardins | 0.66 | -0.44 | 0.56 | 0.78 |
| Mathieu Perreault | 0.71 | 0.17 | -0.11 | 0.77 |
| Paul Stastny | 0.81 | -0.44 | 0.39 | 0.75 |
| Henrik Sedin | 0.59 | 0.00 | 0.10 | 0.69 |
| Pavel Datsyuk | 0.32 | 0.39 | -0.05 | 0.67 |
| Mark Letestu | 0.37 | 0.12 | 0.17 | 0.66 |
| Lars Eller | -0.17 | 0.29 | 0.41 | 0.54 |
| Valtteri Filppula | 0.66 | -0.10 | -0.03 | 0.54 |
| Nate Thompson | 0.25 | 0.12 | 0.15 | 0.52 |
| Mikhail Grabovski | 0.49 | -0.20 | 0.22 | 0.51 |
| Frans Nielsen | 0.88 | -0.37 | -0.03 | 0.49 |
| David Backes | 0.27 | 0.15 | 0.06 | 0.48 |
| Maxim Lapierre | -0.15 | 0.42 | 0.20 | 0.47 |
| Jeff Carter | 0.42 | -0.02 | 0.06 | 0.46 |
| Joakim Andersson | 0.64 | -0.25 | 0.06 | 0.46 |
| David Legwand | 0.29 | 0.29 | -0.15 | 0.44 |
| John Mitchell | 0.64 | -0.07 | -0.14 | 0.43 |
| Brad Richards | 0.71 | -0.02 | -0.28 | 0.41 |
| Jamie Benn | 0.44 | -0.22 | 0.13 | 0.35 |
| Mikael Granlund | 0.44 | -0.17 | 0.07 | 0.34 |
| Casey Cizikas | 0.22 | -0.02 | 0.09 | 0.29 |
| Mike Fisher | 0.47 | -0.47 | 0.28 | 0.28 |
| Saku Koivu | 0.10 | 0.10 | 0.05 | 0.24 |
| Nicklas Backstrom | 0.88 | -0.34 | -0.34 | 0.20 |
| Tyler Bozak | 0.54 | 0.05 | -0.42 | 0.17 |
| Luke Glendening | 0.05 | 0.15 | -0.06 | 0.13 |
| Michal Handzus | -0.32 | 0.44 | 0.01 | 0.13 |
| Logan Couture | 0.61 | -0.64 | 0.15 | 0.13 |
| Matt Stajan | -0.49 | 0.61 | -0.12 | 0.01 |
| Nick Bonino | 0.47 | -0.39 | -0.12 | -0.04 |
| Sidney Crosby | -0.10 | -0.22 | 0.26 | -0.06 |
| John Tavares | 0.49 | -0.27 | -0.32 | -0.09 |
| Marc-Andre Cliche | 0.71 | -0.54 | -0.29 | -0.12 |
| Artem Anisimov | 0.32 | -0.44 | 0.00 | -0.12 |
| David Krejci | 0.44 | -0.69 | 0.11 | -0.14 |
| Brandon Sutter | 0.00 | -0.29 | 0.05 | -0.24 |
| Nick Bjugstad | 0.51 | -0.56 | -0.23 | -0.28 |
| Kyle Brodziak | -0.42 | 0.25 | -0.12 | -0.29 |
| Aleksander Barkov | 0.66 | -0.76 | -0.21 | -0.31 |
| David Desharnais | 0.02 | -0.56 | 0.20 | -0.34 |
| Matt Duchene | 0.02 | -0.76 | 0.18 | -0.56 |
| Sean Couturier | -0.25 | -0.07 | -0.24 | -0.56 |
| Patrik Berglund | -0.07 | -0.39 | -0.11 | -0.57 |
| Ryan Getzlaf | 0.42 | -1.15 | 0.15 | -0.58 |
| Tomas Plekanec | 0.44 | -0.54 | -0.52 | -0.62 |
| Kyle Turris | 0.22 | -1.00 | 0.16 | -0.62 |
| Cody Eakin | -0.10 | -0.22 | -0.33 | -0.65 |
| Evgeni Malkin | 0.00 | -0.81 | 0.12 | -0.69 |
| Tyler Johnson | 0.00 | -0.96 | 0.14 | -0.82 |
| Gregory Campbell | -0.64 | -0.20 | 0.01 | -0.82 |
| Sam Gagner | -0.54 | 0.00 | -0.42 | -0.96 |
| Mikael Backlund | -0.20 | -0.51 | -0.25 | -0.96 |
| Cody Hodgson | -0.02 | -0.98 | -0.14 | -1.15 |
| Sean Monahan | 0.29 | -1.30 | -0.27 | -1.27 |
| Riley Nash | -0.76 | -0.56 | 0.04 | -1.29 |
| Derick Brassard | -0.39 | -0.93 | -0.03 | -1.35 |
| Bryan Little | -0.34 | -0.98 | -0.14 | -1.47 |
| Adam Henrique | -0.51 | -0.76 | -0.28 | -1.55 |
| Andrew Shaw | -0.51 | -0.86 | -0.20 | -1.57 |
| Brayden Schenn | -0.44 | -1.08 | -0.30 | -1.82 |
| Tyler Seguin | -0.47 | -1.15 | -0.42 | -2.04 |
| Patrik Elias | -0.51 | -1.23 | -0.36 | -2.10 |
| Olli Jokinen | 0.00 | -1.79 | -0.32 | -2.11 |
| Derek Stepan | -0.02 | -1.49 | -0.63 | -2.15 |
| Tyler Ennis | -1.20 | -0.61 | -0.50 | -2.32 |
| Mark Scheifele | -0.78 | -1.25 | -0.29 | -2.32 |
| Mike Ribeiro | -0.37 | -1.79 | -0.23 | -2.39 |
| Nazem Kadri | -0.91 | -1.45 | -0.18 | -2.53 |
| Ryan Nugent-Hopkins | -0.51 | -1.45 | -0.77 | -2.73 |
There are a few short comings with this, in that the model is considering average expectations.
Losing losing a faceoff is about equal in importance as how you defend from a faceoff loss. The same is true with winning a faceoff. A player may win faceoffs in the defensive zone, but hurt the team due to inability to break out. The model is automatically assuming that all these NHL centres are equally effective in shot-impact when they win or lose a faceoff, nor do they all face the same level of competition in shot-impact.
Another thing that is being assumed is shooting percentages. The truth is not all team’s are equal in shooting talent. The truth is not all team’s are equal in goaltending talent.
Still, the discrepancies in these areas are small enough with the sample size that the general trend is likely on spot.
Now compare these goal values to what the spread of talent in shot metrics tends to equate in terms of goal value:
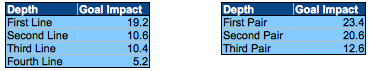
This is comparing the average goal differential difference over 82 games between the top 10 percentile in Corsi percentage versus the bottom 10 percentile for 2007-12.
