Back to Basics: Forward Univariate Analysis

Uni - CF%2League wide univariate analysis isn’t very sexy, which is why you rarely see it used in the hockey blogosphere. Still, the information is necessary in better understanding what we are describing and adding context. It is also useful for looking back at whenever a variable may not impact or work in a model as you initially hypothesize.

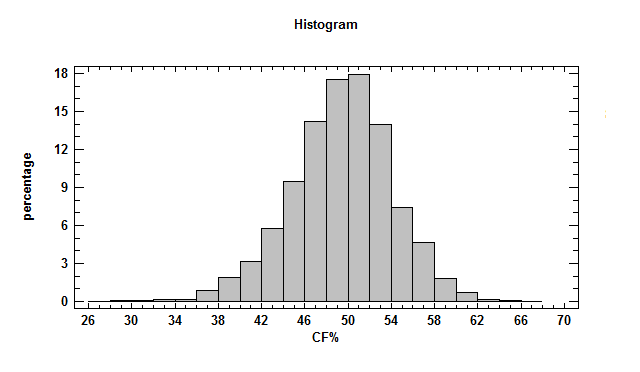
I gathered all player season data for each full (excluding lockout) season available in the “Behind the Net era”, filtering only forwards with 100 or more minutes. These seasons were combined into one massive sample of 2368 player seasons. Continue reading

Goaltender Performance vs Rest

Photo by Michael Miller, via Wikimedia Commons

Photo by Michael Miller, via Wikimedia Commons

I couldn’t find this data (if it’s out there, please point me to it), so I went back to 1987 and pulled goaltender performance vs games rest. We knew goalies did poorly in the second game of a back-to-back pair, but I’m surprised to see such a large gap for two and three games. (The overall dataset is roughly 40000 games.)

Days between Games % of Games Mins (G1) Mins (G2) Shots Vs (G1) Shots Vs (G2) Sv% (G1) Sv% (G2) W% (G1) W% (G2)
1 9.5 54.7 55.0 28.9 29.7 0.905 0.897 0.498 0.421
2 35.6 57.0 56.8 28.7 28.7 0.908 0.901 0.522 0.486
3 19.2 57.1 56.7 29.0 29.0 0.905 0.900 0.514 0.481
4 12.1 56.7 56.3 29.2 28.7 0.899 0.898 0.477 0.487
5 7.2 55.4 55.2 29.0 28.8 0.892 0.899 0.440 0.448

There are lots of systematic issues here (e.g. most back-to-back games are on the road) but simplistically, this would mean goalie rest obscures the bulk of a goaltender’s value. That seems implausible and worth looking at in more detail…

Bayes-Adjusted Fenwick Close Numbers: Week 4

Mikko Koivu may actually really be the captain of a dominant possession team.

Two more weeks have passed since we last updated our Bayes-Adjusted Fenwick Close (BAFC) Numbers.  This means we now have a lot more data and our BAFC standings are starting to really be affected by this year’s results – significant changes have happened in the last two weeks, and results from this season are starting to be thought of as actually real. Continue reading

Re-examining Fenwick and Playoff Success

Pavel Datsyuk

Pavel Datsyuk and the best Fenwick team in recent history lifted the Cup in 2008

Image from Dan4th Nicholas via Wikimedia Commons

Back in April of 2013, Chris Boyle presented his study of the relationship between a team’s Fenwick percentage in close-score situations and their eventual success in the Stanley Cup playoffs. Since then, there’s been two Stanley Cup playoffs played. Also the previous 2007-08 start point for shot attempt data was extended two years backwards thanks to War on Ice. All told, it’s an another four seasons of data added to the five Boyle examined.

Worth another look, in my opinion.

Continue reading

Bayes-Adjusted Fenwick Close Numbers: Week 2

Adding John Scott may have added a needed goal scorer to the Sharks, but their possession numbers are falling fast.

Another week, another week of possession data in the NHL.  Thankfully, while last week several teams had only played 3 games, this week the minimum # of games played is 6, so our minimum sample size for our Bayes-Adjusted Fenwick Close #s (BAFC) is now 6 games of data.   And with more data, we’re starting to see the numbers for this year have a greater impact on the possession rankings so far.

In case you missed our introduction to BAFC last week, BAFC is simply taking last year’s possession numbers and, weighting them by # of games played this year (more games, less importance), combining them with this year’s possession numbers to try and come up with a more predictive estimate of what each team’s true talent fenwick close really is.  It’s far from perfect, and indeed, the weighting formula is definitely arbitrary, but it does paint a nice picture that is not prone to overreacting to small samples. Continue reading

Bayes-Adjusted Fenwick Close Numbers – An Introduction

With the season upon us, and multiple stat sites now hosting team and player fancystats, it is pretty tempting for a hockey fan (well, one who’s into fancystats) to try and check how his team is doing in possession in close situations – in other words, in Fenwick Close (alternatively, score adjusted fenwick). The problem with this, of course, is that the sample sizes are currently so small as to make the #s pretty meaningless – some teams have played as few as 3 games, so you can’t make any judgments based upon these numbers on their own.

But, as I mentioned on twitter, we can still try and take these numbers and make something out of them, using our prior knowledge of the NHL to make judgments. For example, I can look at current fenwick close #s and pretty confidently state “Buffalo is going to be a terrible terrible team” at this point, despite the sample size, given our prior knowledge of what the Sabres are. In other words, we can incorporate current fenwick close #s into a Bayesian Analysis.

Continue reading

How much does matching competition matter on a team level?

This is certainly a terrible matchup – Matt Martin vs Alex Ovechkin – but it’s not an example really of terrible line management.

Quite frequently in talk about lines of a hockey team, you’ll find talk about how a certain team should be matching up certain lines against certain opponents.  For example, a recent comment to me on twitter stated roughly that: “As long as the Isles match-up the Frans Nielsen line with the Canes’ Eric Staal line, they’ll be in great shape” – as the Canes basically only had one quality line (the Staal line) at the time of that comment.  But as I replied on twitter, that isn’t quite right:

Competition, on a possession level, is pretty much a zero sum game in hockey.

Continue reading

2014-2015 Season Preview: The Metro Division

Image from Michael Miller via Wikimedia Commons

Last year, in preseason, the Metro Division, was considered by far the strongest division in the East and the likely bet to take both Wild Cards.  The whole division, minus the Pens, promptly started the season by getting hammered, only recovering later in the season to grab one of the two wild cards.

This year again, the top 5 of the division looks strong enough to take two wild cards.  The bottom 3, particularly the bottom 2, are very weak, but the top 5 is strong and near evenly matched such that they could wind up in any order.  But, given the requirement to project the division, these are how I believe the division should finish up, from worst to first:

Continue reading

2014-15 Preview: The Central Divison

Image from Matt Boulton via Wikimedia Commons

If you’re a fan of a Central Division team that doesn’t employ Ondrej Pavelec, you’re probably feeling optimistic as we approach the upcoming season. And you should: this is clearly the best division in the NHL, and all six of its non-Manitoban clubs have legitimate playoff hopes.

Of course, not all six will reach that milestone; at least one will join Winnipeg on the outside looking in. At this time, however, few can agree on how the standings will shake out. The Stars have been projected anywhere from second to fifth; the Avalanche have been slotted everywhere but last. Some are high on the Blues, others are sick of them constantly disappointing.

This uncertainty should make for an exciting year in “Conference III.” Below is a team-by-team breakdown of the league’s toughest division:

Continue reading

2014-15 Season Preview: The Atlantic Division

Image from Sarah Connors via Wikimedia Commons

Finishing last season with an average of 87.6 points per team, the Atlantic/Flortheast Division was the worst in the NHL. I see that gap widening, not narrowing, in 2014-15.

The battle at the top of the division will, in my eyes, come down to two teams: the Boston Bruins and the Tampa Bay Lightning. The Bruins have placed either first or second in their division (the Atlantic or the former Northeast) in each of the past four seasons. The 2nd place Lightning finished a full 16 points behind the Bruins in 2013-14, but a strong off-season combined with a full season of Steven Stamkos and rookie Jonathan Drouin potentially making an impact has them near even money with the Bruins.

Continue reading