
 League wide univariate analysis isn’t very sexy, which is why you rarely see it used in the hockey blogosphere. Still, the information is necessary in better understanding what we are describing and adding context. It is also useful for looking back at whenever a variable may not impact or work in a model as you initially hypothesize.
I gathered all player season data for each full (excluding lockout) season available in the “Behind the Net era”, filtering only forwards with 100 or more minutes. These seasons were combined into one massive sample of 2368 player seasons.
Games played
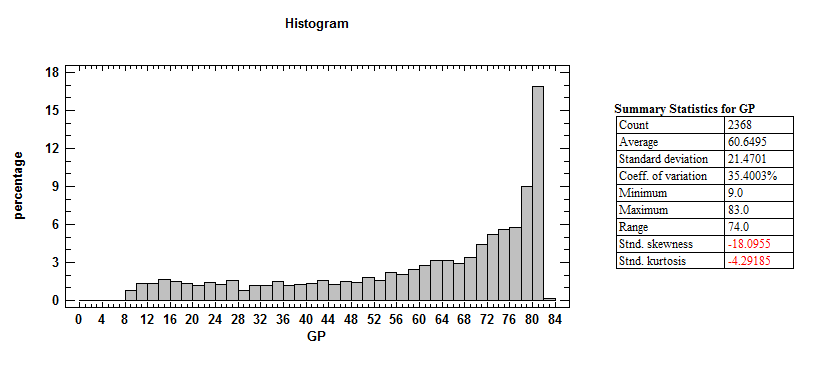
When ever discussing a player as “above average” or not in a particular facet, one must check if the data is skewed or normal. If it is normal shaped, a regular average -also known as mean- can be used. If not, the distribution’s median is more appropriate. Games played is heavily left skewed, as one would naturally expect with injuries and call-ups.
The mean for this data is 60.6 games played, but the median value is 69 games. Less than 20 percent of players play 81 games or more. Interestingly there are three individuals that played 83 games due to being traded within the season. About 36.6 percent of players play less than 60 games.
Time on ice per game played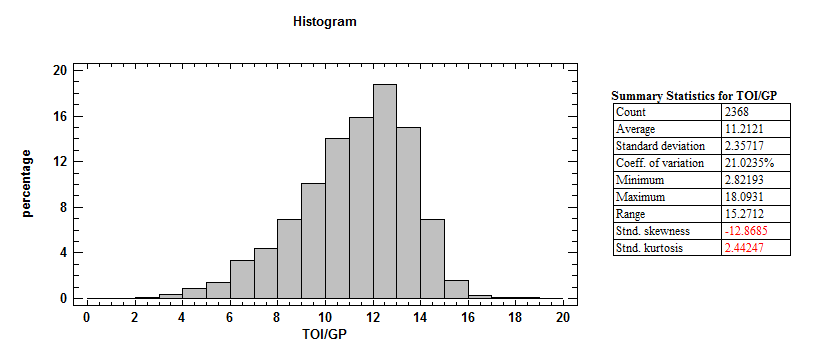
Again we see the data heavily skewed. The median value is 11.6 minutes per game, and 762.7 per season, while the mean is 11.2 and 702.4 respectively. Interesting to note how quickly the distribution falls off after fourteen minutes.
As one would expect, most of the outliers in the games played and time on ice per game are the same players.
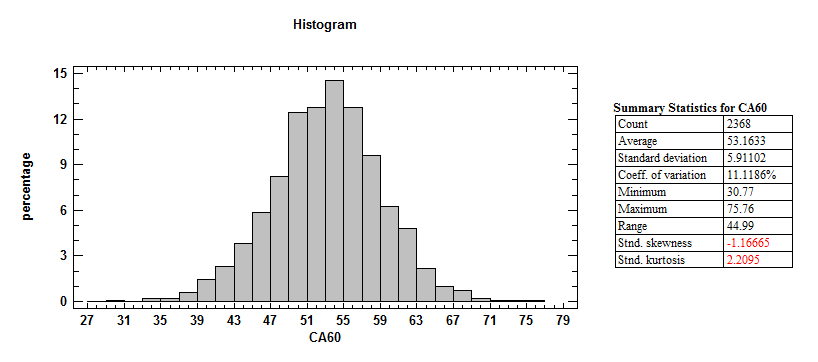
On-ice shot attempts for per sixty minutes
Corsi events for per sixty minutes ends up being far more normal shaped than the previous two statistics. Both the mean and median sit around 52 shot attempts per sixty minutes.
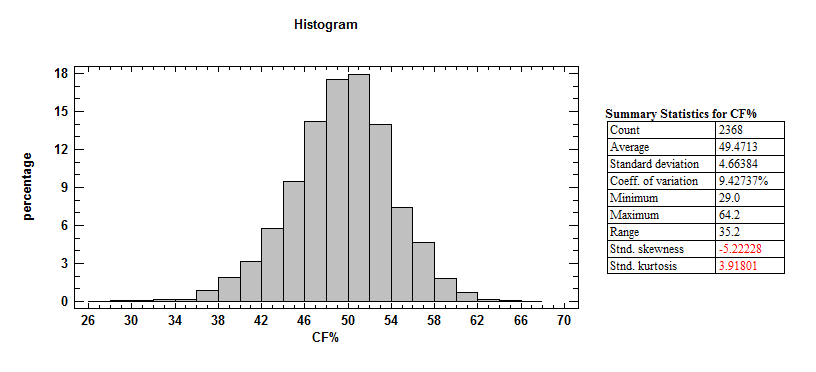
On-ice shot attempts against per sixty minutes
We find the distribution for Corsi events against per sixty minutes to be slightly less skewed than Corsi events for, but has bit more kurtosis than a normal distribution. Both the mean and the median sit around 53 shot attempts per sixty minutes. This means that more of our sample is in the negative shot differentials than positive, which brings us to…
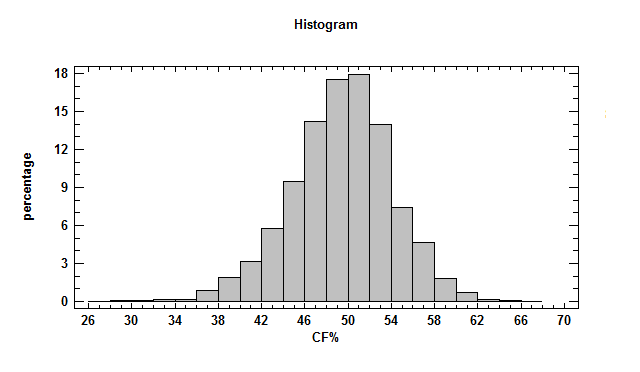
On-ice shot attempts for as percentage of total
As expected, the average Corsi percentage is below 50 percent, with a 49.5 mean and a 49.7 median. The skew left is predominately from players who played only limited minutes in the NHL and did poorly in them (which is likely part of the cause for them only playing so few minutes).
Even with the low minute threshold, we still find 96% of the sample to fall within the expected 40-60 range of sustainable value.
Teammate and opponent Corsi percentage
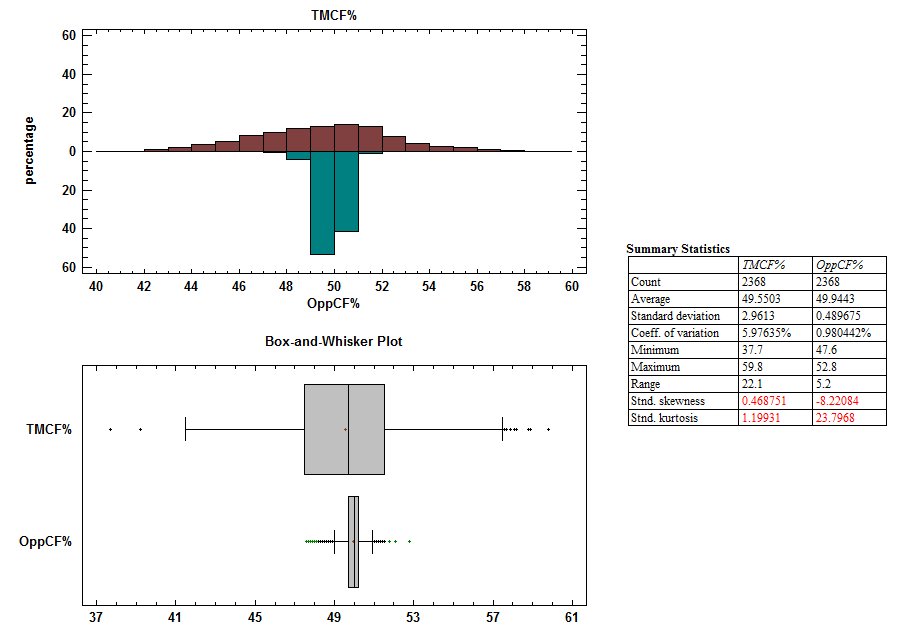
Teammate and opponent Corsi percentages are simply the average Corsi percentage of a player’s linemates or opponents for all minutes when away from said player.
Statistical analysts often mention that linemates create a far larger impact than linematching on a player. These distributions show the major reason for this: the distribution in opponent strength over an entire season is quite small.
The distribution of teammate Corsi percentage follows a very normal shape, while opponent Corsi does not. Nearly fifty percent of teammate Corsi percentage dwells outside of the opponent Corsi percentage’s limits.
I added a box-and-whisker plot to help you see how a distribution looks like in that form as opposed to a histogram for those not experienced in statistical graphing. Take a few looks as the next two graphs will be of the same ilk.
Percentage of face offs deployed in defensive, offensive, and neutral zone
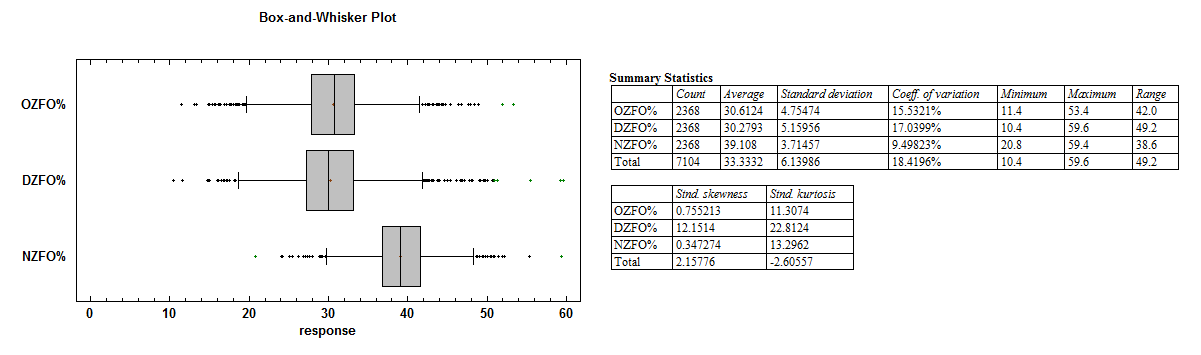
One thing often glanced over is that two players can have the same ratio of defensive versus offensive zone starts but have a difference in the percentage of shifts beginning in either zone. It depends on the percentage of shifts that they start in the neutral zone.
We see here that the deviation and variation of neutral zone starts is just over half that of the other two variables.
It is also interesting to see that only defensive zone starts have a skewed shape, and by quite a bit too.
Goals, assists, and points per sixty
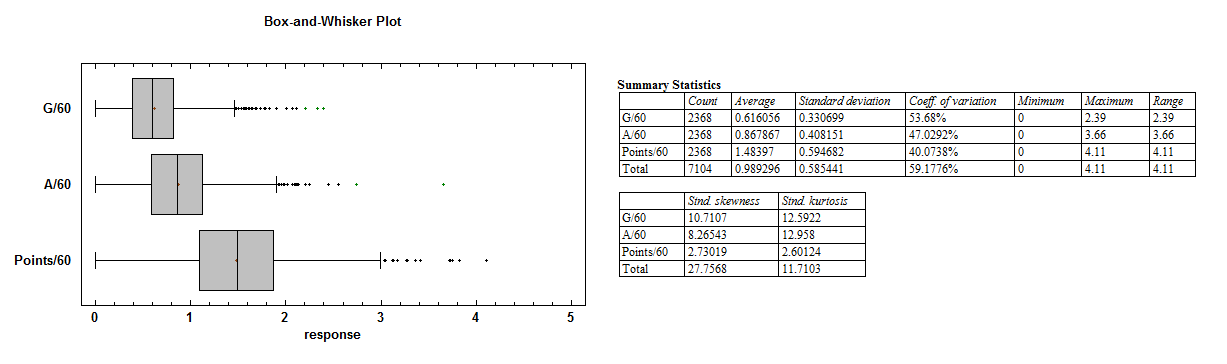
All three of the variables are heavily skewed to the right (thanks Crosby). This is interesting to note because we often see people citing players who score relative to average. I’d guess that most of the time that average is the mean, but with this skew it would be more accurate to use median.
In this case, the medians for goals, assists, and points are 0.60, 0.86, and 1.49. Not a huge difference from the mean, but accuracy and honesty is always necessary for analysis.
