
INTRODUCTION
I have always been of the opinion that Corsi is part of the larger puzzle in trying to gain greater understanding of the game and how a player can affect their team’s chance to win. Like all statistics though, it needs appropriate sample size and context, and will never tell you everything. Teammates, opponents, luck, system, strategy and what moments a coach deploys a player will always effect results… although, there can also be times where context is overly stressed. While Corsi does tend to need less context than many other hockey statistics, there are some things that need to be kept in mind in how two players with the same Corsi% are not always created equally.
Tyler Dellow wrote a piece on context that is definitely worth a read. In the article Dellow used two tables showing how Corsi changes dependent on ice time for the 2011-12 season.
We will revisit this article using a larger sample and look at both forwards and defensemen.
METHOD
As Dellow did in the above mentioned article, all forwards were taken for the 2011-12 season from behindthenet.ca. This was then repeated for 2007-08, 2008-09, 2009-10, and 2010-11, bringing up a total of four seasons of data, which is all five full seasons in the BTN era.
The players were arranged by average time on ice per game, and divided into approximately equal sized buckets for numbers of games played, where each bucket represented a line in depth (Fig. 1 + 2). Within each line, the players were organized in order of Corsi% and then separated into subcategories of approximately equal size for number of players.
This was then repeated for defensemen.
Analysis ensued.
RESULTS AND DISCUSSION:
Figure 1: 2007-12 NHL forwards in equal buckets of combined games played + fourth bucket split in half
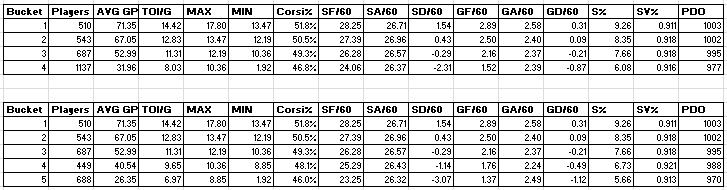
The first half of the figure shows results similar to that Dellow came out with. So overall, this is pretty much what the “average” first, second, third and fourth line look like in the NHL. This of course lacks context given such as competition, linemates and zone deployment; however, these details do not seem substantial enough to change the trends seen above. It is important to also keep in mind that empty net goals are still considered 5v5 for BTN, which means there is going to be a slight skew for top players, especially in goals against.
The second table was to further test a statement given out by Gabriel Desjardins long ago: “Hockey teams, by and large, do know what they are doing. Coaches have a very good understanding of their players.” Dellow also makes a similar comment in his own article with “a lot of the time, the data says things that hockey people would believe anyway, with the added benefit of providing some scale as to how significant some phenomenon or tactic is.”
The test was to see if the trend stays true between 4th line players and depth call-ups. The fourth bucket was split evenly, again by games played, and it does seem that both statements are verified by the data. However, a trend is not the same as perfection; most analysts (statistical or not) could tell you that pretty much all teams have their imperfections in player management (no one is perfect after all). The strength in analytics for hockey is giving an opportunity for teams in improving the grey areas of their player management.
Figure 2: 2007-12 NHL defenders in equal buckets of combined games played + third bucket split in half
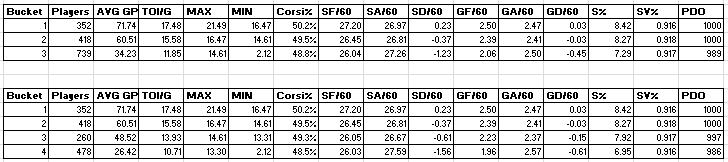
Another test in this article was to see if the trends seen above with forwards in Fig. 1 remain true for defensemen. There have been times where detractors of advance stats have proposed that Corsi is not as significant for defensemen as it is for forwards, yet many of the trends still exist in similar fashion.
With the defensemen, there is a positive relationship with Corsi and how coaches select their players for ice time. As with forwards, there is also a trend for depth players to produce inferior results than bottom pair defensemen.
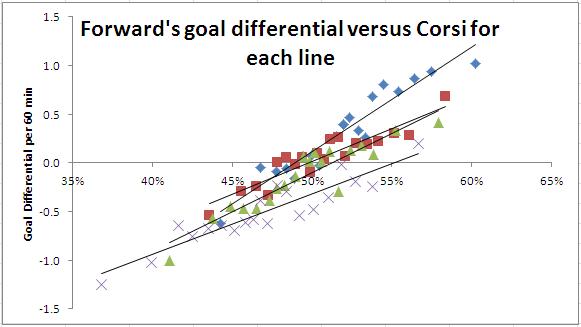
Figure 3: 2007-12 lines and pairs subcategorized by Corsi%
The data table is far to big to place on here, but I have made it available on Google Documents for your viewing pleasure.
There are a lot of patterns you can pick up from this data, many of which I’ll be looking into further in future posts. The two I want to concentrate on today though are: 1) the relationship between Corsi% and goal differential and 2) that a “good or bad” Corsi value is relative dependent on the context of which line a player is (ie: a good Corsi% for a 3rd liner is not quite the same as a good Corsi% for a 1st line player).
It should be noted that not all players from the original data are involved in Fig. 3 or any subsequent figure. There were problems with outliers from players with only a few games played since some never saw a goal for and/or against. To allow for some regression, a minimum game played threshold of twenty was used for this and every table or graph hereafter.
Figure 4: Forward goal differential predictive modeling given Corsi% & TOI
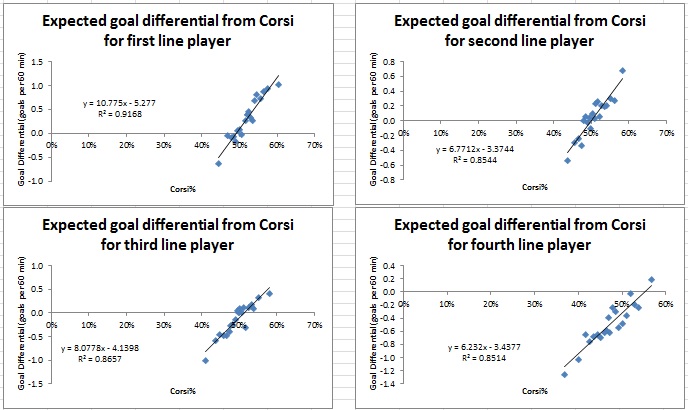
A problem Corsi has had -in a public-acceptance sense- is that neither the name nor the idea of shot attempts sparkle with naturally layman intuition. Shot attempts are not the goal of hockey and discussions of Corsi predominately exists on the internet (although this is rapidly changing). Goal differentials are the preferred outcome, but -for reasons we discussed earlier in Outputs vs Inputs– they are not very good in player evaluation.
One neat thing we can do though is modeling. Thanks to the poor sustainability of on-ice shooting percentages, the difference in goaltender talent, and the low-occurrence of goals, goal differentials are highly volatile. Corsi though is not affected by goaltending or shooting percentages and stabilizes much earlier. By averaging out 20ish players in each point, the volatility to goal differentials diminishes severely. Therefore, you can look at a lines Corsi% and get a good idea at how much they are helping/hurting a team, and even make that relative to league average for the same lines on different teams.
Most players fall between 40-60%, which has previously noted by Ben Wendorf. Another thing to note is that that while the average for each line is different they predominately overlap in Corsi%; however, the expected goal differential per minute for different lines is quite different given the same Corsi%.
Another interesting thing to note is the steepness in the curve for 1st and 3rd line players relative to that of second and fourth line players. Is it possible that this is due to coaches tending to either use their first or third line as shutdown lines? Or is it just merely anecdotal or chance that they are slopped this way?
Figure 5: Defensive goal differential predictive modeling given Corsi% & TOI
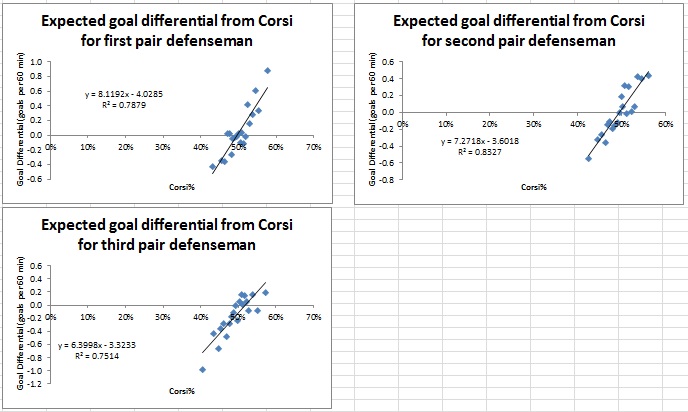
Again we see a strong relationship in a players Corsi and goal differentials, although the R^2 value on average is marginally lower than that for forwards. Once again we can take Corsi% and a player’s TOI, and measure in goals a more probabilistic model on how the player or line affects a team.
IN CLOSING
As I said earlier, Corsi is just one part of the much larger puzzle in regards to evaluating players… but it is a very important part of the puzzle.
As we gain a greater understanding in how players affect these numbers and what should be expected given situations, we can derive more potent ways in analyzing how a player affects the game.
In the future we may be able to separate Corsi into its individual parts (like Stephen Burtch has been doing with dCorsi), add in context/usage variables (like Quality of Teammate or Zone Start %) and maybe even offensive production (like %TSh or P/60) to create an improved model over the one we see here.

“the expected goal differential per minute for different lines is quite different given the same Corsi%.”
I think causality is working in both directions here.
Basically what you’re observing is that guys who play more have a higher PDO than guys who play less.
Part of this is because greater skill can lead to both playing time and high PDO, butit’s also true that a world with imperfect player evaluation can see a hot streak lead to both playing time and a high PDO.
An example of this: if you try to assess the impact of fatigue on production by looking at how players’ scoring rates change when they play more minutes, you find that they score more per minute when they play more. That’s not because they get stronger as the game goes on; it’s because the higher scoring rate led to more playing time.
Yes, that is likely a factor, although I’m not sure how much. My suspicion is what you are saying is why we see a crossover for 1st and 2nd lines at the lower Corsi%’s on the top graph.
We see this same crossover with 1st and 2nd pair Dmen at low Corsi% as well.
Another factor is probably coaching. Bottom 6 lines are asked to play differently, ie: safe. This likely influences PDO to a (likely small) degree.