Defensive defensemen are struggling in the playoffs

It has been said that a “stay-at-home” defensive defenseman’s value expands in the post season. The theory behind this supposes that the looser rules regarding physical force and obstruction play into these defender’s strengths. However, this is not always the case.

Thus far, we have seen some of the larger names in the business struggle in their roles.

Continue reading

2013-14 Stanley Cup Preview

Untitled

40-60% is the normal typical spread in the NHL

Later today the Los Angeles Kings will be facing off against the New York Rangers. The Los Angeles Kings have been the heavy favourite both throughout the mainstream media and the fancystats blogger community, with talk of the Kings winning in 4 or 5 with ease.

Is this valid?

Let’s look together do some very surface level analysis.

Continue reading

How Something as Important as Shot Quality is not that Important

Graph courtesy of @MannyElk

ABSTRACT

Shot quality versus quantity was once debated intensely in the hockey analytics blogosphere; however, this has since diminished severely. Still, many in the general public struggle with the idea of something that is important for players and teams to strive for doesn’t add much in data analysis. This exercise helps demonstrate some of the concepts using data.

Continue reading

More on “Corsi & Context”, with some added predictive modelling

Corsi

INTRODUCTION

I have always been of the opinion that Corsi is part of the larger puzzle in trying to gain greater understanding of the game and how a player can affect their team’s chance to win.  Like all statistics though, it needs appropriate sample size and context, and will never tell you everything. Teammates, opponents, luck, system, strategy and what moments a coach deploys a player will always effect results… although, there can also be times where context is overly stressed. While Corsi does tend to need less context than many other hockey statistics, there are some things that need to be kept in mind in how two players with the same Corsi% are not always created equally.

Tyler Dellow wrote a piece on context that is definitely worth a read. In the article Dellow used two tables showing how Corsi changes dependent on ice time for the 2011-12 season.

We will revisit this article using a larger sample and look at both forwards and defensemen.
Continue reading

Consistency in the NHL: How often do teams tend to play “their game”

Source: Bruce Bennett/Getty Images North America

INTRODUCTION:

Our very first published article used shot attempt differentials to see if certain teams were more consistent than others in their performance. We observed that teams differed greatly in how they performed on average, but not so much in their levels of consistency, as in the spread of their performances.

One of the commentators of the article, under name of “Anthony Delage” wondered if team’s differed much in playing “their game”, or in other words: how often low-event team’s play low-event games vs high event teams play high-event games.

See more after the jump.

Continue reading

Input versus Output: An Ongoing Battle that No One Knows About

XKCD comics is written by Randall Munroe, a physicist who probably doesn’t know what  hockey underlying numbers (ie: #fancystats or advance statistics) even are, let alone supports them… yet – for the most part – he gets it.

Mainstream sports commentary is full of poor analysis when it comes to using numbers appropriately. Most of this comes from a lack of understanding between the difference between inputs versus outputs and how much a player can control certain factors. (It should be noted that this is a broad generalization; not everyone falls into this category).

Benjamin Wendorf displayed a bit of these factoids in his recent article Why The Hockey News’ Ken Campbell is Wrong About Alex Ovechkin, but Campbell still didn’t get it.

What happened:

For those that do not know, here is a quick summary of Campbell’s article:
Continue reading

Save Percentage vs the Experts: Round one, introduction of concepts

Photo Cred: Eric Hartline-USA TODAY Sports

Due to starting my dive into hockey statistics as a Winnipeg Jets fan, save percentage has always been a pretty big interest of mine, specifically in what it can and can’t tell us. The truth is, it is still a pretty rudimentary statistic and likely will be improved upon in the future. However, simple does not always mean bad or useless.

Of the three most common “goaltender statistics”, save percentage is the one controlled most by goaltenders. How can I be so sure of that? Well it can be provided with simple logic.
Continue reading

A Tale of Two Riverboat Gamblers: Analytically Comparing Jack Johnson and Dustin Byfuglien

Source: Harry How/Getty Images North America

There are probably enough fan bias tendencies in sports to fuel psychology graduate theses for years to come. Sometimes these biases even creep into the minds of hockey’s brain-trusts, including GMs, coaches, and national team selection committees.

One such bias is the propensity against players who are strong offensively but can be a risk defensively. Whether these offensive players are a net-positive to the team depends on whether their offensive output outweighs their defensive lapses. Period. You win the game by out-scoring, not by just increasing your own scoring or limiting your opponents. However, if you were to survey most fanbases, you would probably find very few defensive risk-type defenders that are considered a net-positive.

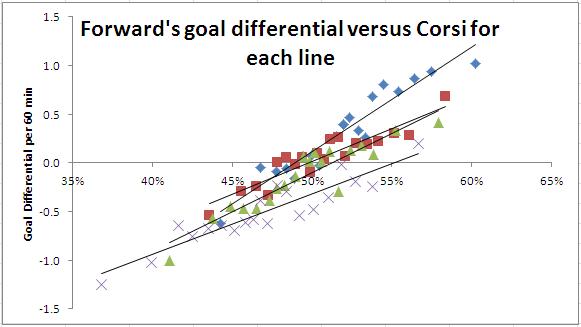
When it comes to the traditional plus/minus statistic, there are great intentions of evaluating a player’s net contribution, but the statistic ultimately fails at achieving this. There are a few issues with plus/minus, one of them being sample size; another fault to the statistic is its low repeatability, which is its ultimate failure. This unreliability in plus/minus relative to most other statistics can be seen here:

Using analytics, we can demonstrate how numbers help differentiate two gambling defensemen who have been the butt-end of scrutiny from their fanbase.

Continue reading

Consistency in the NHL: How much does consistency vary in the NHL relative to performance

Photo Cred: John Woods (The Canadian Press)

INTRODUCTION:

It is not unusual to hear fans or media claim lack of consistency in a team’s performance as the main culprit to a team’s failing record, rather than the alternative narrative in a team just not being as good on average.

Fortunately there is a way to test this hypothesis in mathematics, specifically statistics.

Corsi is one of the strongest gauges in assessing a team’s success due to Corsi’s strong relationship with scoring chances and puck possession, even within a single game sample spacing. This evaluator is even stronger when restricting to “score-close” minutes to limit score effects.

How well a team performs game-to-game on average can simply be evaluated using the average, or mean, of a team’s Corsi differential for all of their games. Consistency can also be evaluated mathematically using standard deviation, a measurement in the magnitude of dispersion from the mean value.

Continue reading