

Photo Cred: John Woods (The Canadian Press)
INTRODUCTION:
It is not unusual to hear fans or media claim lack of consistency in a team’s performance as the main culprit to a team’s failing record, rather than the alternative narrative in a team just not being as good on average.
Fortunately there is a way to test this hypothesis in mathematics, specifically statistics.
Corsi is one of the strongest gauges in assessing a team’s success due to Corsi’s strong relationship with scoring chances and puck possession, even within a single game sample spacing. This evaluator is even stronger when restricting to “score-close” minutes to limit score effects.
How well a team performs game-to-game on average can simply be evaluated using the average, or mean, of a team’s Corsi differential for all of their games. Consistency can also be evaluated mathematically using standard deviation, a measurement in the magnitude of dispersion from the mean value.
METHOD:
The number of Corsi events for and against was mined for each game and for each team at the statistical website extraskater.com for the 2013-14 NHL season. Each game was then placed into a differential per 20 minutes of play.
The mean and standard distribution of each team’s set of games was then calculated, which was then tabulated into one pool to be analyzed.
RESULTS AND DISCUSSION:
Figure 1: Mean and standard deviation of each NHL team’s Corsi per 20 minutes
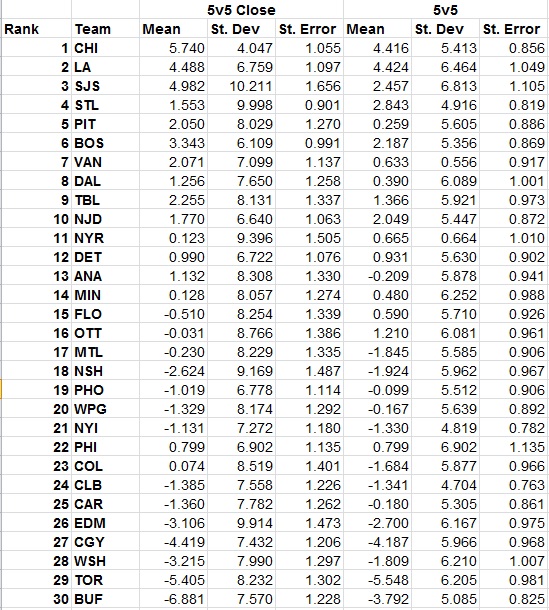
*Teams are ordered in CorsiClose% rank according to extraskater.com
For score-close minutes, the spread in teams’ mean performance is greater than two times larger than the spread in teams’ standard deviation. In addition, there is no major relationship with a team’s rank and their consistency, while there is a positive relationship with mean performance and team strength.
When including all 5v5 minutes the difference between the range in team’s mean and standard deviation of performance lessens, although the range in means is still larger by about 50%. The relationships between mean and standard deviation and rank persists similarly to score-close minutes.
When moving from score-close to all 5v5 minutes there is a decrease in the spread of mean values, but the spread in standard deviation values is about the same. This, combined with score effects, is likely the main cause of the perception in a team’s consistency or lack thereof.
Interestingly, the most consistent and least consistent team’s for score-close minutes are top 3 ranked teams Chicago Blackhawks and San Jose Sharks, yet both standard deviations fall into the norn when looking at all 5v5 minutes. This could be due to sampling bias, as both teams have been highly successful, especially at the start of the season, and have taken large, early leads quite regularly.
Figure 2. Histogram of team’s data
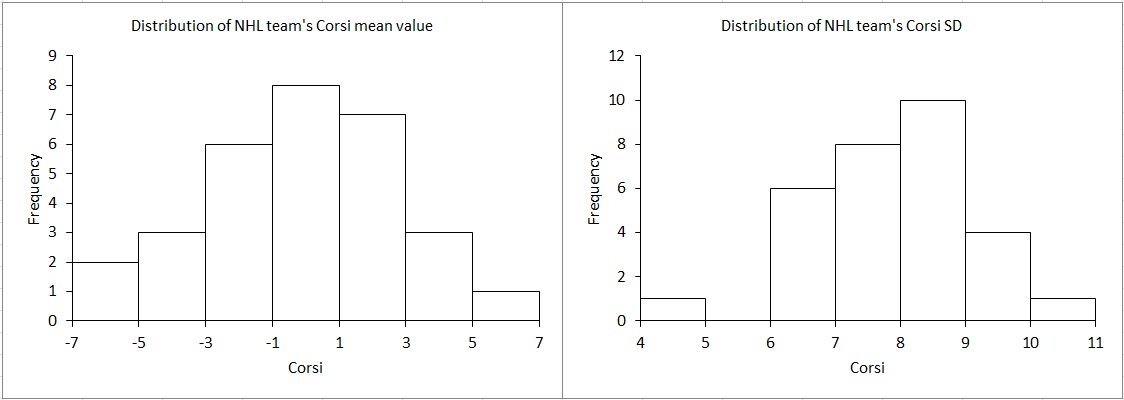
Visually there is a large difference in how teams tend to perform on average relative to the deviation in their performances.
Not only is the spread much larger in the mean values, but also if you remove the two extreme values in Chicago and San Jose, you only have a spread in about 4 Corsi events per twenty minutes of 5v5 time in the standard deviation histogram.
Figure 3. Mean and standard deviation between teams
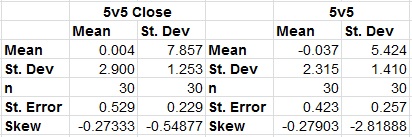
Mathematically there is much greater variation between how team’s perform on average then there is in their standard deviations. In other words, there is not much difference between team’s consistency as there is difference in how team’s tend to perform.
CONCLUSION:
For the most part, there seems to be very little difference between teams in their consistency; the big difference between teams is how they perform on average. The better a team is on average, the more often they will be the stronger team and have the greater chance in winning.

One wonders if there is a correlation between the systems employed and “consistency”.
Nice post. Consistency is always the first thing fans single out as the problem with their team, and it’s nice to see evidence how it really isn’t a thing that certain teams have better than others in any meaningful way.
I think if there’s one thing stats folk are, it’s patient. How often do people overreact to small samples?
I guess it’s in our nature, along the lines of the “once bitten, twice shy;” regardless, some times people need to chill out and wait for the numbers to roll in for awhile.
One thing I’ve always wanted to look at, and it seems like you have the data set to do it here, is whether teams can consistently control the event rates in games they play. The standard deviation of total events (Corsi or Fenwick) for a team’s games would ideally show if a team is able to “play their game” consistently. Looking at road data only would matter here, since home scorer bias would come into play. Players and coaches always talk about playing “their game”, leading me to wonder whether that actually has an impact on winning games.