

Source: Harry How/Getty Images North America
There are probably enough fan bias tendencies in sports to fuel psychology graduate theses for years to come. Sometimes these biases even creep into the minds of hockey’s brain-trusts, including GMs, coaches, and national team selection committees.
One such bias is the propensity against players who are strong offensively but can be a risk defensively. Whether these offensive players are a net-positive to the team depends on whether their offensive output outweighs their defensive lapses. Period. You win the game by out-scoring, not by just increasing your own scoring or limiting your opponents. However, if you were to survey most fanbases, you would probably find very few defensive risk-type defenders that are considered a net-positive.
When it comes to the traditional plus/minus statistic, there are great intentions of evaluating a player’s net contribution, but the statistic ultimately fails at achieving this. There are a few issues with plus/minus, one of them being sample size; another fault to the statistic is its low repeatability, which is its ultimate failure. This unreliability in plus/minus relative to most other statistics can be seen here:

- Traditional stat reliability by SnarkSD: http://www.arcticicehockey.com/2011/7/16/2273803/ssw-forward-g-a-pts-pim-reliability-and-regression-to-the-mean
Using analytics, we can demonstrate how numbers help differentiate two gambling defensemen who have been the butt-end of scrutiny from their fanbase.
The Players:
Dustin Byfuglien and Jack Johnson have more similarities between them than just their defensive-zone lapses. Both were considered for the American Olympic team. Both have started this season with a negative goal-differential, below their team’s average. Also, both this season are being used predominantly against top 6 opponents.
However, this is where their similarities end.
Performance with Forwards:
Figure 1: 2013-14 Forward 5v5 Corsi% when with Byfuglien or Johnson
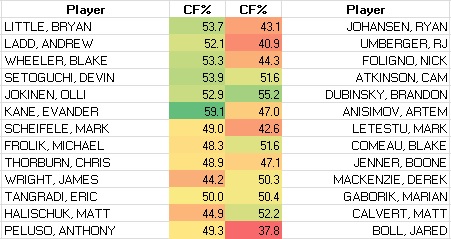
* all WOWY data comes from stats.hockeyanalysis.com
The forwards are listed in order of time-on-ice with the defenseman. The split is near-even, with Byfuglien being at or above 50% with 7 of his 13 forwards and Johnson with 6 of his. There is the difference, though, that Byfuglien’s positive numbers above are predominantly with the forwards he spends more time-on-ice with (read: better sample), while Johnson’s are predominantly players with smaller samples.
Figure 2: 2013-14 Forward 5v5 Corsi% difference with Byfuglien or Johnson than without
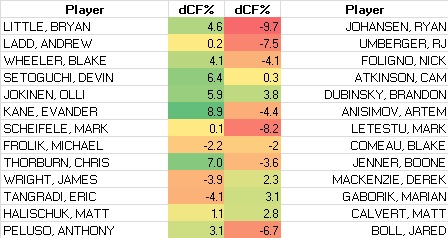
The results are far more stark here. Byfuglien improves the results for all his forwards but three, and one of those three (Eric Tangradi) is one of the players that was at or above 50% in the previous example. Johnson, on the other hand, is mostly on the negative side, with him hurting more of his forwards than helping. Again we see that Byfuglien’s “green” results are predominantly with those with a greater sample, while the opposite trend exists with Johnson, leading us to believe that as sample grows the dispersion between the two would increase.
Performance with Defensemen:
Figure 3: 2013-14 Defense 5v5 Corsi% when with Byfuglien or Johnson
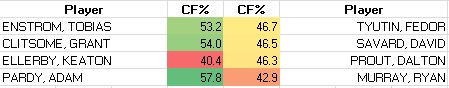
The pairing sample sizes are a lot smaller as both have spent most of their time with one or two other defensemen. Still, Byfuglien is once again the defenseman that comes out looking better between the two, with 3 of 4 partners severely out of the red. Johnson, meanwhile, doesn’t sit above-par with any defenseman. There is unlikely much difference in skill between longtime depth defensemen Keaton Ellerby and Adam Pardy, so it is likely that some of the disparity in results is due to usage differences and sample bias when together or apart from one another.
Figure 4: 2013-14 Forward 5v5 Corsi difference with Byfuglien or Johnson than without
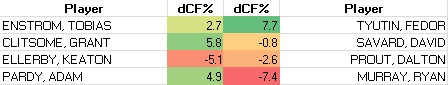
Not much difference here than our previous example with the exception that Tyutin’s results have been much better with Johnson than without. It should be mentioned the sample bias is likely more stark with the defense-pairing WOWY’s than forwards, as many defensemen do not have significant time without their main partner. In our example with Fedor Tyutin, almost all of his non-Johnson minutes are with Dalton Prout and are far below 100 minutes.
When it comes to WOWY’s like these, the biggest thing to take is the general trend as you are chopping up sample sizes, thus increasing the chance for sample bias.
Overall Change in Team Results
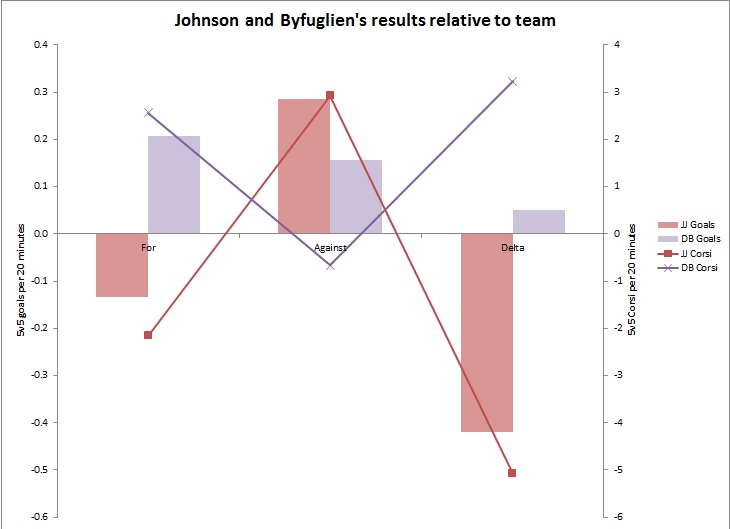
Figure 5: 2011-14 Byfuglien’s and Johnson’s Effects on Team’s Goals and Corsi in Score-Close Minutes
Ed. Note: click the image for a better, larger version.
The above shows how Johnson and Byfuglien change their team’s goal or Corsi events per 20 minutes of 5v5 score-close minutes for all events-for, -against and differential. It has been shown historically that over time goal events regress towards Corsi events, given equal goaltending.
Byfuglien has been able to increase his team’s offensive production in chances and goals by a great margin, while Johnson has struggled to do the same. Some of this has to do with Johnson playing a lesser offensive role behind Drew Doughty during his time with the Los Angeles Kings, a fact made clearer when you remove Johnson’s minutes with the Kings. Without those minutes, Johnson is still in the negative for offensive creation although not as extreme (not shown here). While offensively-talented, many of his problems are likely due to spending a great amount of time trapped in his own zone. His defensive liabilities are essentially influencing his offensive creation.
Not many would argue that Byfuglien has experienced superior goaltending behind him as compared to Johnson. The combination of Jonathan Quick, Sergei Bobrovsky, and Steve Mason is for the most part superior to that of Ondrej Pavelec, Al Montoya, and Chris Mason. Yet still, Byfuglien comes out on top. Defensively, Johnson seems to allow an increase of both chances and goals; with Byfuglien though, we see a split in goal and shot suppression: Byfuglien seems to suppress shots slightly yet still more goals go in against his team with him on the ice than without. There could be an argument made by either side that the difference between the Corsi and goal results for Byfuglien is due to sample size or Byfuglien’s nature. While either side or both could be right, it should be noted that Johnson likely creates similar amounts in quality and quantity of defensive gaffes, and doesn’t experience the same “boost.” As Wendorf mentioned yesterday on Hockey-Graphs, Dustin Byfuglien’s on-ice save percentage is for the most part the same as Duncan Keith. Eric Tulsky has also shown on Broad Street Hockey that defensemen are largely unable to control save percentage.
The data here consists of one full season, one lockout season, and one season still in-progress. Due to plus/minus’s extraordinarily slow tendency to regress to the mean, as shown in the first graph from AIH above, and this sample space restriction, it is most likely that in time the goal events data will move closer to the Corsi event data.
Overall the results are quite definitive, with a stark difference between the two. While one defender improves his team the other is a net-loss, despite the fact that their fanbases have the same gripe about their #1 defenders.
Summary
Some players are not good for all 200 feet of the ice. It does not mean that those players are not a net-positive nor helping the team overall. The difference is dependent on whether or not their offensive abilities outweigh their defensive inabilities, which human perception has historically been terrible at evaluating.
Between Dustin Byfuglien and Jack Johnson we can see this difference; one player can make up for their defensive issues and the other cannot. The big difference likely extends from their ability to push the play forward – while both defensemen increase their team’s goal against, Johnson’s aptitude for being trapped within his own zone increases both his team’s goals and chances-against while suppressing his own offensive creation. Byfuglien, on the other hand, spends a large amount of time in his opponent’s defensive zone, and therefore limits the number of chances that occur against his team.
The great Dave Tippett was once quoted:
“We had a player that was supposed to be a great, shut-down defenseman. He was supposedly the be-all, end-all of defensemen. But when you did a 10-game analysis of him, you found out he was defending all the time because he can’t move the puck.Then we had another guy, who supposedly couldn’t defend a lick. Well, he was defending only 20 percent of the time because he’s making good plays out of our end. He may not be the strongest defender, but he’s only doing it 20 percent of the time. So the equation works out better the other way. I ended up trading the other defenseman.”
“The proof is in the pudding” seems to be a popular saying when talking about Byfuglien (both Gary Lawless, Benjamin Wendorf and myself have used it previously). The pudding is right in front of all of us if we are willing to look.

How dare you, Jack Johnson was near-unanimous choice for the US selection committee.
Seriously, though, Dustin Byfuglien and his value will not be understood during his career (I’m predicting right now).