

Source: Bruce Bennett/Getty Images North America
INTRODUCTION:
Our very first published article used shot attempt differentials to see if certain teams were more consistent than others in their performance. We observed that teams differed greatly in how they performed on average, but not so much in their levels of consistency, as in the spread of their performances.
One of the commentators of the article, under name of “Anthony Delage” wondered if team’s differed much in playing “their game”, or in other words: how often low-event team’s play low-event games vs high event teams play high-event games.
See more after the jump.
METHOD:
The number of Corsi events for and against was mined for each road game for each team at the statistical website extraskater.com for the 2013-14 NHL season. Each game was then placed into a total per 20 minutes of play.
The mean and standard distribution of each team’s set of games was then calculated, which was then tabulated into one pool to be analyzed.
This was then repeated for the 2011-12 and 2012-13 NHL seasons.
Then a few other fun graphs and relationships were compared.
RESULTS AND DISCUSSION
Figure 1: 2013-14 mean and standard deviation of each NHL team’s total Corsi per 20 minutes
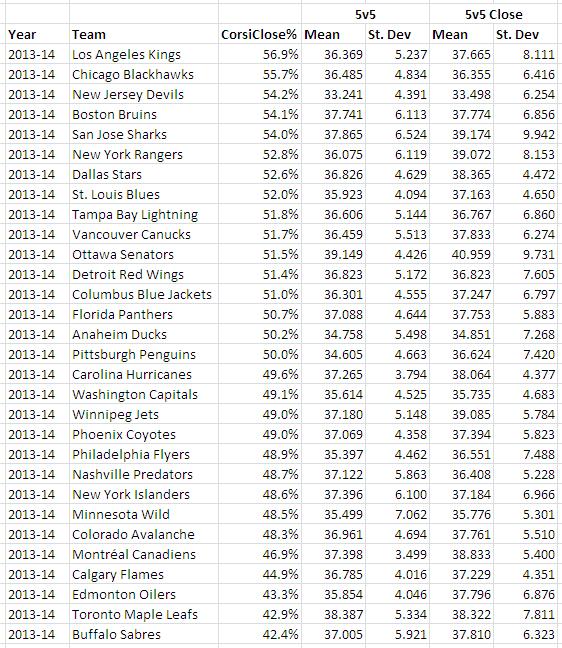
Unlike in our first post when looking at differentials, there is a larger comparative difference in the standard deviation when looking at team’s playing consistently a low or high events game.
Figure 2: 2013-14 mean and standard deviation of NHL’s mean and standard deviations
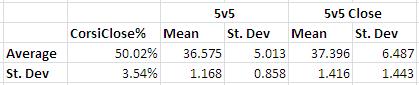
As shown here, the standard deviation of standard deviations is similar to the standard deviation of mean values of events (say that ten times fast). In other words, the spread in teams playing high and low event games is about the same as the spread in ability to play consistently their particular style.
So, what does this mean for team’s in playing their game-style?
I hypothesized that a team’s ability to play a low or high events game was about 50% under their control and 50% the other team’s. So, I did what every other analyst does when they have a hypothesis: grabbed more data and tested it!
If teams had about equal level in control of their play-style, we would expect a parabolic type shape to our data. This would be because teams in the middle would face both lower and higher event teams and are not far removed from either extrema, while teams at the extrema would be facing team’s all the way up to the other extrema.
Figure 3: 2011-12 mean vs standard deviation in Corsi-Close events
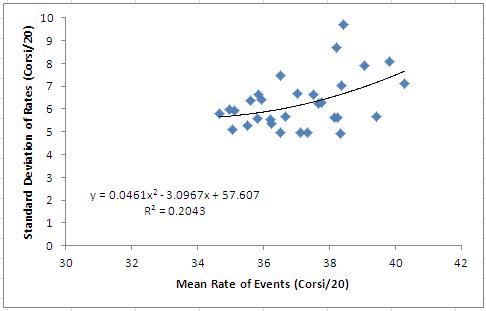
Figure 4: 2012-13 mean vs standard deviation in Corsi-Close events
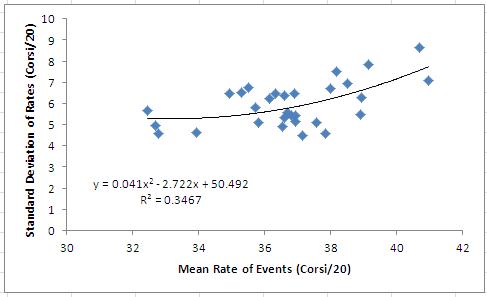
Figure 5: 2013-14 mean vs standard deviation in Corsi-Close events
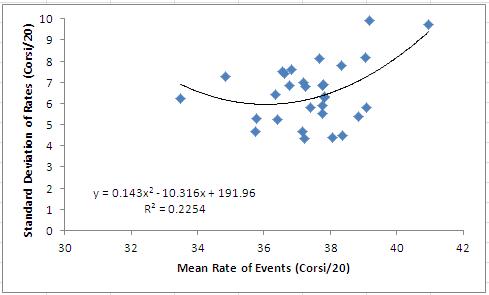
Figure 6: All three seasons combined (2011-14) mean vs standard deviation in Corsi-Close events
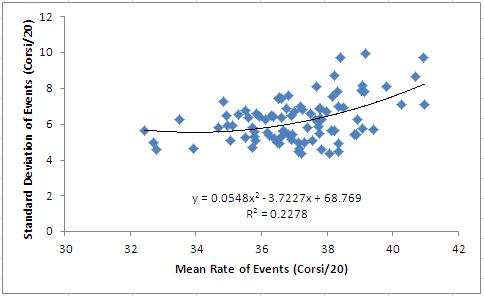
In all 4 cases, a parabola gave us our strongest R^2, which goes along with what we would expect if my theory was correct. However, what was unexpected, we see the parabola leans heavily to the left, meaning that low event teams tend to be more consistent in being able to play their game-style over high event teams.
Figure 7: Relationship with Corsi rates and Corsi-Close%
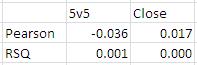
Both mean 5v5 rates and mean 5v5 Score-Close rates had no real relationship with a team’s CorsiClose%, meaning being a low or high event team had no real relationship with being a superior possession team.
This makes sense as having a large amount of events could be anything from dominating to being dominated consistently.
CONCLUSION
It seems that for a team’s ability to play “their game” is subjected to who they play against as well as their own play-style. Lower event teams tend to succeed in playing lower event games more consistently than higher event teams tend to succeed in playing higher event games, but other team’s are going to pull you a bit into their game.
BONUS SECTION: WHAT TYPE TEAM IS YOUR TEAM?
Figure 7: 2013-14 teams’ mean event rates for road games

The teams are listed in order of highest to lowest current CorsiClose%; you can click the image for a larger view

Damn Devils and their event recording…
It’s road data, so no devil’s scorers bias in that
Ah gotcha. In that case…wow.
Thanks for the shout-out and putting the work in. Love the methodology here, very solid work.