Sportlogiq, Passing, and Playmaking

Embed from Getty Images

Last, week, two pieces were posted that talked about a player’s “playmaking” ability. I put it in quotes because it’s a term that gets tossed around a lot and sometimes isn’t defined by those using it. For example, in this piece from Andrew Berkshire (using data from SportLogiq), it is never clearly defined despite being in the title of the piece. Passes are categorized based on direction (north, south, east-west), zone (offensive zone, neutral zone), or some other qualifiers (to the slot, off the rush), but nowhere are they tied to shots. Passes are charted based on “successful pass volume” per twenty minutes. One can assume these are pass completions per twenty minutes. However, with hundreds of passes completed each game, many of them are simply woven into the noise of the game. We’re interested in what leads to events, specifically exits, entries, shots, and goals. Berkshire includes exit and entry passes, so at least those are present. Nevertheless, despite zero detail on what matters most – creating shots for teammates – Berkshire concludes that “we may be witnessing the beginning of the best playmaker of the next generation of NHL stars in Barkov.”

The other piece I referred to was this by Travis Yost on Joe Thornton. He clearly explains what he means by playmaker”: “To me, a playmaker in the NHL is the guy who routinely creates opportunity for his linemates.” Thornton is without a doubt a 1st ballot Hall-of-Famer and one of the best setup men in the league. It’s only natural to think of the man that once made Jonathan Cheechoo lead the league in goals as one of the greatest playmakers we’ve seen over the last decade. Yost’s definition of creating opportunities for teammates is one I would agree with.

If only there was a publicly available set of data that including passing and shot assist numbers for Barkov and Thornton. Oh, wait… All data is at 5v5 because no one cares about special teams except for Arik Parnass.

Continue reading

2015-16 Hockey Graphs Midseason Awards

Embed from Getty Images

With the league returning from the completely predictable All-Star festivities (I didn’t see the game but can only presume that John Scott screwed the whole thing up, since that’s what Gary Bettman implied would happen), there’s no time like the present to look back at the first 50 games and take stock of the NHL season that’s been so far. And since the only thing better than arbitrary lists or rankings is many arbitrary lists or rankings, we here at Hockey Graphs have put together our picks for each of the end of season major awards.

Continue reading

Redefining Shot Quality: One Pass at a Time

Shot quality has been a topic of late on hockey twitter and various sites. Only a few weeks ago, the Hockey-Graphs Hockey Talk  was centered around this topic. Shot quality is a lightning rod and much of the talking at or past one another that people often do stems from a single issue: there is no agreed-upon definition of what people mean when they say “shot quality.” Well, I like what our own Nick Mercadante had to say on the subject:

Establishing a base, repeatable skill that accounts for pre-shot movement and an increased likelihood of a goal being scored are what we need to properly analyze player contributions. Quantifying passing also gives us another actionable piece of data that everyone understands and coaches can use as well. Often, the simplest metric or method is the best. And, we should able to do that now that we’ve obtained a significant set of data. This chart may look familiar, but it’s essential to understanding how important passing is to goal-scoring. This is from all tracked passing sequences from the six teams (Chicago Blackhawks, Florida Panthers, New Jersey Devils, New York Islanders, New York Rangers, and Washington Capitals) that we tracked last season.

SH%Sequence

From this point on, I want you to forget whatever it is you think of when you hear the term, “shot quality.”

Continue reading

Expected Goals Data Release

bergy goal
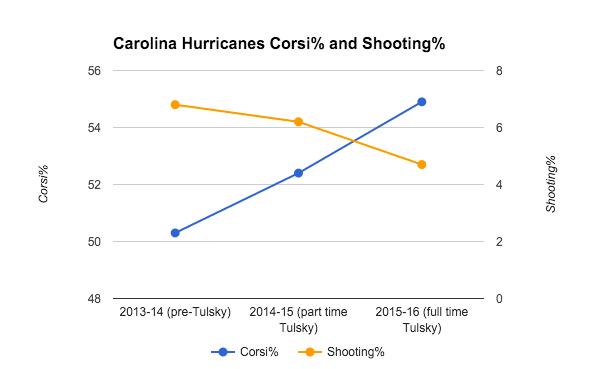
Back in October 2015,  @asmae_t and I first unveiled an Expected Goals model which proved to be a better predictor of team and player goalscoring performance than any other public model to date. Thanks to the feedback of the community, a few adjustments and corrections were made since then. The changes were the following:

  1. Score state was a variable that was accounted for in the model but was not explicitly mentioned in the original write-up. Recall that after accounting for all variables, including score state, it was found that a shot attempted by a trailing team still has a lower likelihood of resulting in a goal than a shot taken by a leading team.
  2. The shot multiplier in Part I of the original write-up was adjusted using a historical weighted average instead of in-season data. Thus, a 2016 shot multiplier for example would be based on the average of the regressed goals (rGoals) and regressed shots (rShots) of 2014 and 2015.  This adjustment improved the model’s performance against score-adjusted Corsi and goals % in predicting future scoring, as seen in the graph below. We thank @Cane_Matt again for pointing out this error. Corrected Version of xG

Continue reading

Special Teams Analytics in the 21st Century

BestPPPredPlot1

Despite them accounting for approximately 20 percent of NHL game time, special teams have been largely ignored when it comes to analytics. Considering the data available and its small sample size compared to even-strength, that is somewhat understandable, and there have certainly been attempts to properly quantify and assess power plays. So what do we know so far? Continue reading

Predicting Which Players Will Succeed on the Powerplay

Embed from Getty Images

Alexander Semin did not have a good season last year. After producing decent numbers in his first two seasons in Carolina, with 35 goals and 51 assists in 109 games, Semin struggled in 2014-2015, putting up only 19 points over 57 games and seeing his shooting percentage drop below 10% for only the second time in his 10 year career. With three years remaining on a contract paying $7MM per season, the Hurricanes decided to cut their losses, buying out the Russian winger prior to the start of the UFA period in July.

While at first glance Semin’s release seems like a reasonable response for a former top scorer who appeared to have lost the magic touch, if we look at little closer at Semin’s numbers a different story beings to emerge. Semin logged only 1.5 minutes of powerplay time per game in 2014-2015, down more than 2 minutes from his 2013-2014 total, and well below the 4+ minutes he would see at the start of his career in Washington. While other factors certainly played a role in his fall from grace (a 97.5 PDO at 5-on-5 doesn’t help), there’s no denying that the coaching staff’s decision to keep Semin off the ice when the ‘Canes were up a man cost him (and likely the team) points.

Although Semin is an extreme case, the general story of a player losing points as his powerplay time decreases is not uncommon amongst NHLers, and illustrates that opportunity often matters just as much as ability when it comes to a player’s results. Each team’s powerplay minutes are limited, and valuable to both the team and player, given the higher scoring environment that exists when a team is up a skater. Overall, teams scored roughly 25% of their goals on the powerplay last year, despite the fact that less than 20% of total ice time was played with a team on the man-advantage.

Continue reading

Hockey Talk: Shot Quality

Embed from Getty Images

Hockey Talk is a (not quite) weekly series where you will get to view the dialogue among a few Hockey-Graphs contributors on a particular subject, with some fun tangents.

This week we started from a Twitter conversation suggesting that expected goals calculations (xG) might underweight “shot quality”. A topic that HG contributors are hardly short of opinions on. Continue reading