
 Back in October 2015, @asmae_t and I first unveiled an Expected Goals model which proved to be a better predictor of team and player goalscoring performance than any other public model to date. Thanks to the feedback of the community, a few adjustments and corrections were made since then. The changes were the following:
- Score state was a variable that was accounted for in the model but was not explicitly mentioned in the original write-up. Recall that after accounting for all variables, including score state, it was found that a shot attempted by a trailing team still has a lower likelihood of resulting in a goal than a shot taken by a leading team.
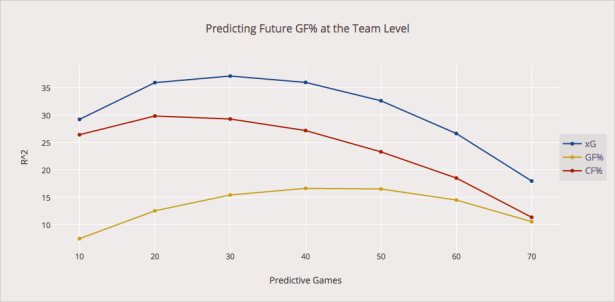
- The shot multiplier in Part I of the original write-up was adjusted using a historical weighted average instead of in-season data. Thus, a 2016 shot multiplier for example would be based on the average of the regressed goals (rGoals) and regressed shots (rShots) of 2014 and 2015. This adjustment improved the model’s performance against score-adjusted Corsi and goals % in predicting future scoring, as seen in the graph below. We thank @Cane_Matt again for pointing out this error.

Without further ado, here is the corrected Expected Goals data from the 2007 to 2015 seasons, organized by Team/Player/Goalie tabs. Please let us know if you have any thoughts, questions, concerns or suggestions in the comments below, via Twitter @DTMAboutHeart and @asmae_t, or by e-mail: DTMAboutHeart@gmail.com.
Here are the links for 2015-2016 data, these will be updated periodically (January 29, 2016):

Thanks for this post #FWIW
With your old data XGF had a strong ~.45 r^2 with points that year.
AS an explanatory variable.
Now it has a small neg. r ^2.-.003 i believe.
I know the goal is to have it predictive and out of sample and you have showed that it is better! Just curious if anyone has any thoughts why it would have a neg r^2 to pts (7 yr sample excluding 2012-2013) — I’m trying to learn more thx!