
Last, week, two pieces were posted that talked about a player’s “playmaking” ability. I put it in quotes because it’s a term that gets tossed around a lot and sometimes isn’t defined by those using it. For example, in this piece from Andrew Berkshire (using data from SportLogiq), it is never clearly defined despite being in the title of the piece. Passes are categorized based on direction (north, south, east-west), zone (offensive zone, neutral zone), or some other qualifiers (to the slot, off the rush), but nowhere are they tied to shots. Passes are charted based on “successful pass volume” per twenty minutes. One can assume these are pass completions per twenty minutes. However, with hundreds of passes completed each game, many of them are simply woven into the noise of the game. We’re interested in what leads to events, specifically exits, entries, shots, and goals. Berkshire includes exit and entry passes, so at least those are present. Nevertheless, despite zero detail on what matters most – creating shots for teammates – Berkshire concludes that “we may be witnessing the beginning of the best playmaker of the next generation of NHL stars in Barkov.”
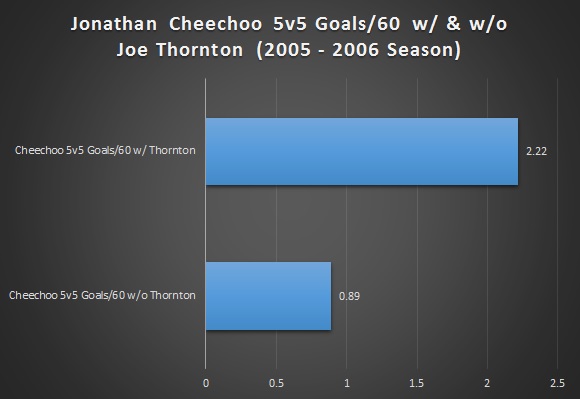
The other piece I referred to was this by Travis Yost on Joe Thornton. He clearly explains what he means by playmaker”: “To me, a playmaker in the NHL is the guy who routinely creates opportunity for his linemates.” Thornton is without a doubt a 1st ballot Hall-of-Famer and one of the best setup men in the league. It’s only natural to think of the man that once made Jonathan Cheechoo lead the league in goals as one of the greatest playmakers we’ve seen over the last decade. Yost’s definition of creating opportunities for teammates is one I would agree with.
If only there was a publicly available set of data that including passing and shot assist numbers for Barkov and Thornton. Oh, wait… All data is at 5v5 because no one cares about special teams except for Arik Parnass.
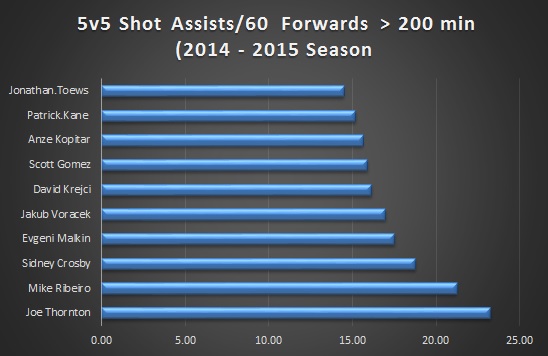
Using the data we collected from last season (500 games), we can quickly see where Thornton ranks among setup men from last season.
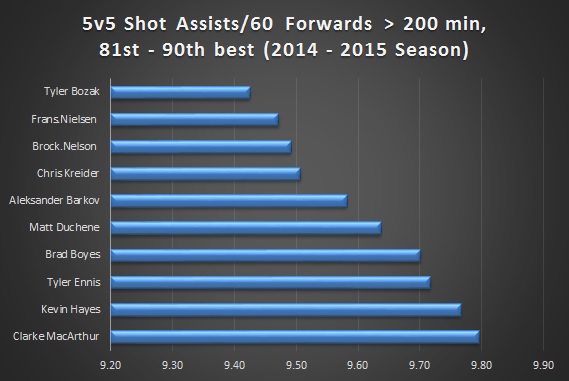
Barkov is nowhere to be found. In fact, you have to scroll down to the 86th best forward, of those we tracked at least 200 5v5 minutes for, to find him. Here are the players just ahead of and behind him.
Now, 86th is still a top-line player (three forwards on thirty teams = ninety first-liners, technically) and he was only nineteen years old last season. Barkov also had a big event on February 26th last season that likely accelerated the conversation around him. That was the day the Florida Panthers acquired Jaromir Jagr from the New Jersey Devils for Kyle Palmieri the draft picks the Devils would then flip to the Anaheim Ducks for Kyle Palmieri. Precisely what impact did that have on young Barkov? Since we have the entire season for the Panthers from 2014 – 2015, we can look at his rates before and after the Jagr trade.
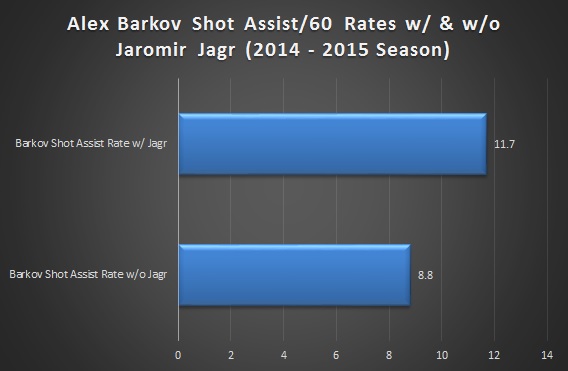
Wow. It appears that elite players have positive effects on their line mates, right? Let’s look at another center who saw his shot assist rates spike with Jagr and have now come down significantly: Travis Zajac of the Devils. Zajac was a staple on the Devils’ top line in 2013 -2014 with Jagr, playing over 900 5v5 minutes together. Last season, due to lineup changes and the Devils trading Jagr away, the duo played only 311 5v5 minutes together. What did that do to Zajac’s production? Have a look.
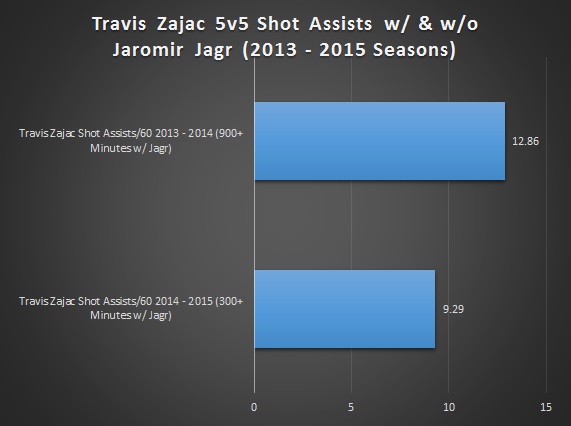
Almost the same boost as when Jagr joined alongside Barkov. It’s more than fair to say that Barkov’s “playmaking” according to Berkshire, has just as much to do with Jagr on his wing as his own development.
I wonder what other playmakers have done this before? Well, Yost mentioned Joe Thornton, so let’s have a look at what happened when he was traded to the Sharks and placed alongside the aforementioned Jonathan Cheechoo.
But He’s Only Twenty, Ryan!
Right. So last season, Barkov was nineteen years old. To be fair to him, let’s have a look at forwards age nineteen who we tracked for at least 200 minutes. Full disclosure, we had 175 minutes for Jonathan Drouin, but I thought his rank was interesting so I included him.
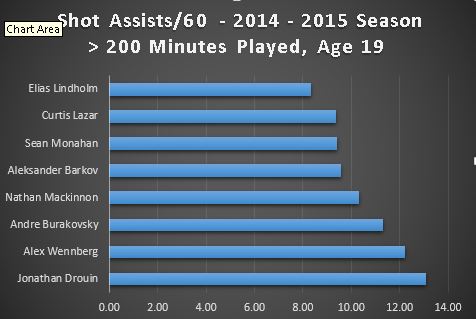
Now with his peers, we see Barkov nestled between Nathan Mackinnon and Sean Monahan. We can also look at the young players (ages 19 – 21) on the six teams we tracked for all of last season (Chicago Blackhawks, Florida Panthers, New Jersey Devils, New York Islanders, New York Rangers, and Washington Capitals) and see where he stood compared to his peers across a full season.
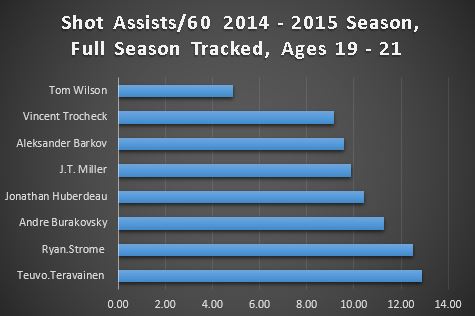
Barkov and Burakovsky were the only nineteen-year olds to make this list. Teuvo Teravainen and Tom Wilson were both twenty last season. The rest of the players are twenty-one.
Conclusions
Look, Barkov is an exciting young talent and has massive potential. He’s twenty years old and his recent extension will likely be one of the best bargains in the league towards the end of it. This isn’t a piece to slam Barkov, but to simply warn against sweeping declarations made from a partial season of data in Berkshire’s piece that undoubtedly was a data dump in reaction to news of his extension. Not to mention the fact that if the best neutral zone passers in the league include two pairs of teammates (Teuvo Teravainen and Artemi Panarin of the Chicago Blackhawks, and Barkov and Jagr of the Panthers), is it possible that there’s a system/role element influencing these numbers? If these numbers are from the entire league, I find this strange. Ignoring the context of playing with an elite-level talent in Thornton and Jagr can sometimes lead to people proclaiming someone as the next big thing.
After all, after the 2006 season, in Cheechoo’s case, people were writing things like this.
Now, Sportlogiq may not be interested in looking deeper into the numbers to see what truly matters, at least publicly. We can do that for them. They have proprietary data that they want to keep secret in order to make money off of various clients and I wish them all the best in doing that. However, pieces like Berkshire’s on Barkov won’t be given a pass because of that fact either.
Barkov will likely continue to grow into a dominant player, but Jagr is a significant reason for his rapid ascendance. Let’s not forget that. He fits in among his age group in terms of playmaking, but hasn’t set himself apart. He is only twenty, though, so let’s see a little more before declaring him the best of his generation.

This article outlines the challenges of hockey analytics. So much depends on the players one plays with. These limitations hinder your analysis as well. A player can be a great passer but if his teammates aren’t very good they will not convert passes into shots. In reality, your Barkov shot assists with/without Jagr stats don’t say all that much about Barkov as much as it says that Jagr is better than most of the other players that Barkov has played with.
We need to be even more careful not to jump to conclusions because it could also mean (although maybe not in this particular example) that when Barkov is playing with Jagr he is assigned an offensive role tasked with generating shots/goals while when not playing with Jagr he is assigned a defensive role tasked more with preventing shots/goals.
As a recommendation, I would suggest incorporating IAP into the analysis, or you could calculate something similar for shot assists (ISAP??). IAP tells you what percentage of the goals that were scored when a player is on the ice did the player have an assist on. ISAP would tell you of all the shots that were taken taken when a player is on the ice did the player have an assist on. This would eliminate some of the effect of Jagr just being a good player.
Looking at the 3-year IAP list (http://stats.hockeyanalysis.com/ratings.php?disp=1&db=201316&sit=5v5&pos=forwards&minutes=2500&teamid=0&type=individual&sort=IAP&sortdir=DESC) you will see some pretty good playmakers rise to the top. Taylor Hall, Joe Thornton, Henrik Sedin, etc.
Both the Berkshire analysis and your analysis have merit and value, as does looking at a stat like IAP or ISAP. On their own they all have limitations as well and can give false signals. In reality, they all should be considered carefully when evaluating a player.
It’s nice speculation there. And a nice plug. But you’re selling a Quality of Teammate metric that (per your usual approach) substitutes wide sampling for regression, as a way of offsetting its grounding in goal-oriented measures. Your recommendation is appreciated, but we ought to be seeking second opinions.
Did you even read what I wrote. I suggested Ryan come up with a similar stat based on his passing metrics which will eliminate the “goal-oriented measure” issues that you have a problem with. I am 100% aware of the limitations of the stat.I am also 100% aware of the limitations of SportLogiq’s stats and the passing projects stats.
I respect the work that Stimson has done. I have regularly praised it as an incredibly important next step in hockey analytics. There is incredible value in it. The unfortunate thing is that this incredible work is getting presenting on this blog run by an obtuse editor(s) that has no problem critiquing other peoples work but gets overly defensive when one critiques an article posted here. The high quality work of Ryan Stimson, Matt Cane, Jack Han and your other authors deserve much better.
Thankfully, they’ve moved on to the second opinion. Because you’re right, they do high quality work, and they saw the same thing I did with your plug.
You have been really pushing the “elder statesman of hockey analytics” thing way too hard lately. These aren’t your children or loyal adherents; they do much sounder work than you ever did, without cherry picking data or using distorted visualizations. I’m not sure what the “obtuse editor” cut is about, unless you consider it obtuse to have a guttural reaction to critiques framed in a paternalistic manner, by someone still baffled by regression, who’s also obviously plugging their site.
The opening paragraph Stimson outlines a fault in Berkshire’s analysis. Paraphrasing it he says Berkshire is not focusing on passes that matter most – those that lead to shots. That is a fair point and is a limitation of Berkshire’s analysis. If two defensemen just pass the puck back and forth to each other in the defensive zone it’s doubtful it provides all that much value. Those would rank very low on the ‘pass quality’ scale but they would certainly boost the ‘pass quantity’ metric.
Stimson then analyses his data and concludes that Barkov is actually not as good of a playmaker as Berkshire points out because it appears to be all Jagr. Again, a perfectly fair point.
The thing is Barkov without Jagr is the same player as Barkov with Jagr. He has the same playmaking skills without Jagr as with Jagr. The fact that his shot assist rate with and without Jagr is so different only tells me that shot assist rate is not a measure of individual talent. Thus any conclusions (including all those in this post) about playmaking ability based on shot assist rate are based on a completely false premise and invalid.
There is value to be had in this passing data and I commend Ryan for the daunting task of collecting it. Unfortunately using raw shot assist rate as to measure playmaking ability is not something of value to come from Ryan’s work. It is simply too dependent on ones teammates. It is quite likely that looking at all passes, as Berkshire is doing with SportLogiq, is a far better method at evaluating playmaking ability (though as stated, not all limitations have been explored and quantified). I do suggest looking at something like ISAP as a potential useful measure as it will potentially reduce some problems surrounding quality of linemates. What you do with that recommendation is up to you guys. You can trash the idea because it came from me and you have some kind of personal dislike for me or you can actually try and find a useful playmaking ability evaluation tool.
As I said initially, your approach is problematic statistically. It becomes personal when you refer to “obtuse editors” and treat people in a paternalistic manner.
How is ISAP problematic statistically?
If I can call on the ghost of Eric Tulsky: http://www.broadstreethockey.com/2013/6/16/4430864/shooting-percentage-regression-goals
Ahhh yes, that is the post where Tulsky says I have been all wrong about the existence of shot quality because I fail to regress shooting percentages and in doing so points out that some players (specifically the ones deemed as being good by coaches and given more ice time) seem to have the ability to post elevated on-ice shooting percentages (aka shot quality) so we shouldn’t regress their shooting percentages as much as he had been previously telling me to regress them. Yeah, I recall that post.
Now, what does that have to do with ISAP?
David,
I’m talking more generally about your ideological and unending quest to prove your notion of shot quality. Frankly, your methods muddy the waters for the rest of the community.
Tulsky said it better than I can. If you are just going to misquote and misconstrue him, then we’re done here.
Two points:
1. Tulsky (and others) for years insisted to me that shot quality was somewhere between non-existent and largely unimportant and that I was completely missing the fact because I wasn’t applying regression only to later find out Tulsky believes in shot quality so he’ll vary the mean he is regressing to based on how good the player is (determined by how much ice time the coach gives them). My debate wasn’t with regression it was with the conclusions that resulted from regression which largely disagreed with reality. That post by Tulsky was a novel one because it actually admitted the existence of shot quality and used that observation to temper how much regression was needed. Unfortunately to this day people insist on applying regression models that way over regress. That is the muddy water that hockey analytics is swimming in (in my opinion).
2. How about you form an opinion of ISAP based on the merits of ISAP, not your opinion of me.
Let’s not overextend the data here; shot quality is still not a major factor. And all of the people who have worked with you on understanding regression over the years (Gabe, Tulsky) are on-record as saying shot quality exists, but the data doesn’t point to it being a major factor. They do seem to have failed to convey the fact that “regression to the mean” is actually “regression towards the mean,” which is precisely part of the reason they had always acknowledged shot quality existed. It’s in there, along with a multitude of other smaller factors. And, of course, Ryan has helped us push towards a more applicable definition of shot quality that teams could actually use.
I would wager that if people are regressing towards the mean because of their data, they aren’t “way over regress”-ing. Now if you want to make the argument that it’s because we’ve not yet received good-enough data…I’m a skeptic, you’re an optimist.
ISAP seems like a reasonable idea because it’s not another goal based metric with no regression in place to account for variance. I encourage you to explore that idea.
I am so tired of the strawman argument that no one except David Johnson thought shot quality was a thing. That was never the argument, and you know that.
“I would wager that if people are regressing towards the mean because of their data, they aren’t “way over regress”-ing.”
But they were. In this article (http://www.arcticicehockey.com/2011/10/10/2479848/on-ice-shooting-percentage-as-a-player-talent) Gabe writes:
“I found that player on-ice shooting regressed 80% to the mean”
That 80% has stuck and it is wrong. It is over-regressing and it has stuck. Garret referenced it in this post (http://www.arcticicehockey.com/statistics/2014/6/10/5784066/advance-statistics-hockey-numbers-reference) and in this comment (http://hockeyanalysis.com/2016/01/14/what-baffles-me-most-in-hockey-analytics/#comment-30973) Matt Cane wrote “Given that he shot about 2% below league average last year, we’d expect him to be around 0.4% below league average this year” which happens to be an 80% regression. I am sure if I looked enough I could find some Tulsky articles where he used the 80% number.
Now, it is important to define what the mean is. In most cases the mean they were using was the league-wide average mean which is a little shy of 8% but for simplicity let’s use 8%. Under this scenario a player that had an on-ice shooting percentage of 10% would be expected regress all the way back to 8.4% and a player who had an on-ice shooting percentage of 6% would regress back to 7.6%. That would make the expected range in shooting percentage approximately 7.6-8.4%. That would mean the best players in the league would score 10% more goals than the worst players.
Now, we could debate whether that is a significant amount or not but it is pointless because it is flat out wrong. It is over-regressing. Let me explain for you in two different ways.
1. Observed results: Of all forwards who have played 3000 minutes from 2007-08 to 2014-15 the standard deviation in their on-ice shooting percentage is 1.1 percentage points. An 8% mean shooting percentage +/- one standard deviation would give a range of 6.9% to 9.1%. That would mean that players one standard deviation above the mean would score 32% more goals on the same number of shots than those players one standard deviation below the mean? Now let’s have the debate about that and whether you think that is minimal.
To put that into perspective the 8-year mean in SF60 is ~29.3 and the standard deviation is 2.4. That would put the one-standard deviation range at 26.9-31.7 meaning with an equal on-ice shooting percentage the +1sd players would score ~18% more goals than the -1sd players.
2. Tulsky’s post that Conor linked to (http://www.broadstreethockey.com/2013/6/16/4430864/shooting-percentage-regression-goals). In this post Tulsky regressed but he chose not to regress to a league-wide mean (which would over-regress). He regressed to a mean for each player based on their ice time. For the ‘best’ forwards in the league (those who had 15 minutes of 5v5 ice time) he regressed their numbers towards a mean of 9.7% and looking from the chart he regressed the ‘worst’ players to something a little over 6%. Let’s say that number is 6.3% so that would equate to the talent range being between 6.3% and 9.7%.
Now, let me quote some of what has been said about shot quality in these comments and in this Hockey Graphs post (https://hockey-graphs.com/2016/01/12/hockey-talk-shot-quality/)
“We already know that the impact of shot quality (context + skill) is miniscule” -@petbugs13
“why does shot quality have so little relative impact on long-term results?” -@Thats_Offside
“Let’s not overextend the data here; shot quality is still not a major factor.” -Benjamin Wendorf
So let me ask you one simple question. Is an on-ice shooting range of 6.5% to 9.5% miniscule? Does it have little relative impact on long-term results? Is it not a major factor?
I ask because all those terms have been used to describe the importance of on-ice shooting percentage either in these comments on the the previous ‘Hockey Talks’ post on shooting percentage (https://hockey-graphs.com/2016/01/12/hockey-talk-shot-quality/).
The fact that you are still basing your arguments on observed data means that, even now after at least six years of exhortations from successive generations of people who have tried to work with you and help you, you do not understand what it means to regress your data. I refuse to engage any longer till you learn to do this.