Never been a meaningful correlation between shot attempts & puck possession. Poor proxy. Shot attempts are valuable but don’t = possession.
— Mike Kelly (@MikeKellyNHL) June 7, 2016
Here you go, Mike, you old stocky codger.
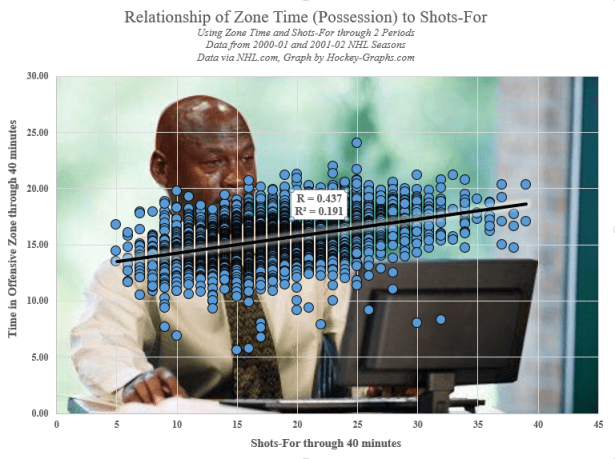
That is meaningful.

Posts tagged with “Resources” include analytical tools and files for readers to use, download, and/or work with.
Never been a meaningful correlation between shot attempts & puck possession. Poor proxy. Shot attempts are valuable but don’t = possession.
— Mike Kelly (@MikeKellyNHL) June 7, 2016
Here you go, Mike, you old stocky codger.
That is meaningful.
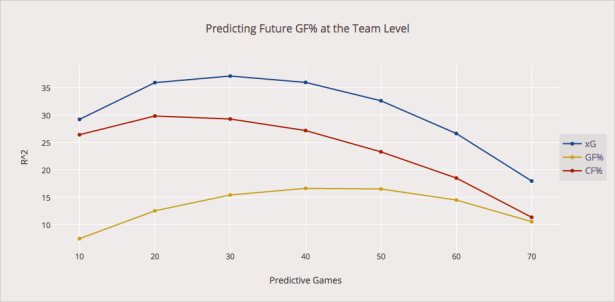
 Back in October 2015, @asmae_t and I first unveiled an Expected Goals model which proved to be a better predictor of team and player goalscoring performance than any other public model to date. Thanks to the feedback of the community, a few adjustments and corrections were made since then. The changes were the following:
5v5 shots, Senators +3% at Jets. pic.twitter.com/xemFFKZ6e1
— Micah Blake McCurdy (@IneffectiveMath) September 30, 2015
//platform.twitter.com/widgets.js
A couple days ago, Micah Blake McCurdy made his first step towards The Great Unknown. It’s a decision hanging on a number of questions we always ask ourselves in the analytics community: What is my work worth to me? What is my work worth to others? For as much time as my spend on it, how can I make sure my work means something, and my time rewarded? How do I make sure my work stays exactly that: mine?
For the past decade, a number of powerful minds have navigated The Great Unknown, finding that apprehensive teams were only willing to commit peanuts and, on rare occasions, real salaried work after a partnership of a couple years. What made The Great Unknown even more of a mystery was the disappearance of sites, and data, and “stats” groups peddling other people’s work (usually in poor or incorrect fashion), and the discovery by some stats analysts that teams had been tracking data in ways that were curious, tedious, unhelpful. When the so-called Summer of Analytics occurred, The Great Unknown had the curtain pulled back a little bit: we started knowing who was getting hired where. But that peek exposed the still-immense uncertainty of the work available with some teams, and opened a new area of intrigue: analytics writing.
So why is what Micah is doing so important?

“2008 NHL Entry Draft Stage” by Alexander Laney. Licensed under CC BY-SA 3.0 via Commons.
Identifying future NHLers is critical to building a successful NHL team. However, with a global talent pool that spans dozens of leagues worldwide, drafting is also one of the most challenging aspects of managing an NHL team. In the past, teams have relied heavily on their scouts, hoping to eek out a competitive advantaging by employing those who can see what other scouts miss. Quite a challenge for many scouts that may only be able to watch a prospect a handful of times in a season. While there has been some progress in the past few years with teams incorporating data into their overall decision making, from the outside, the incorporation of data driven decision making in prospect evaluation has been minimal.
To address this, Josh Weissbock and myself have developed a tool for evaluating prospect potential which we call Prospect Cohort Success (PCS), with the help of others in the analytics community including Hockey Graphs Supreme Leader, Garret Hohl.

“Math lecture at TKK” by Tungsten – photo taken by Tungsten. Licensed under Public Domain via Commons.
Welcome to Sunday Notes, where we try to rehash important developments occurring on Hockey Graphs and elsewhere in the CORSI twitter league in less than 500 words. I’m sorry if we forgot about your post, or misconstrued what you said. We don’t care. Don’t @ us. Just do better next time. – Asmaen

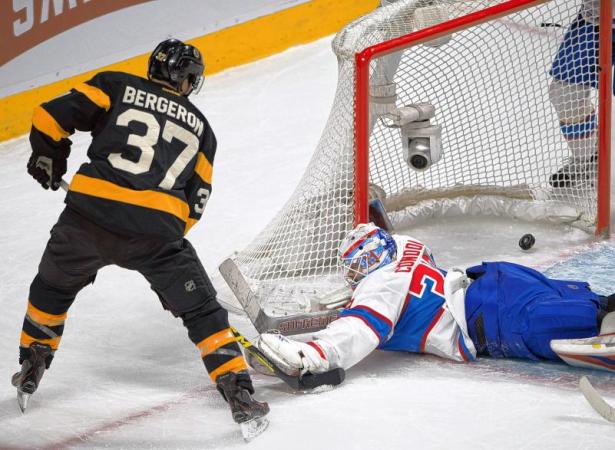
Probably want to keep that middle guy out for the next shift. Photo by Conrad Poirier, via Wikimedia Commons
Determining NHL player peaks has frequently focused on production and, occasionally, wrinkles are added to account for the steeper fall-off for goal-scoring as opposed to playmaking. Generally, the peak appears to be around the ages 23-25, with some skills like shooting exhibiting fairly early peaks and others a bit later.
Poking around some spreadsheets, I came across data that I’ve always meant to get to: time per shift. The NHL has been keeping a measure of average time per shift for players going back to 1997-98, so I licked my chops over the robust data set. The “Why?” for looking at it, I think, takes us to an interesting place. To some degree, time per shift can allude to a player’s stamina and overall physical fitness; it can also allude to the coaching staff’s assessment of their performance — though there are plenty of shifts ended on the fly in a hockey game. What’s more, we simply haven’t had a lot of player peak estimations using time on-ice, and when done carefully, I think we can capture something like a total physical peak for players.
I’ve had a couple of people ask about how to use the new interactive visualizations we offer at Hockey Graphs, so I thought I’d take the time to provide a tutorial with some visual demonstrations.
Edit:There is another version of this article available in pdf which includes more explicit mathematical formulas and an example worked in gruesome detail.
We all know that some games are easier to play than others, and we all make adjustments in our head and in our arguments that make reference to these ideas. Three points out of a possible six on that Californian road-trip are good, considering how good those teams are; putting up 51% possession numbers against Buffalo or Toronto or Ottawa or Colorado just isn’t that impressive considering how those teams normally drive play, or, err, don’t.
These conversations only intensify as the playoffs roll around — really, how good are the Penguins, who put up big numbers in the “obviously” weaker East, compared to Chicago, who are routinely near the top of the “much harder” western conference? How can we compare Pacific teams, of which all save Calgary have respectable possession numbers, with Atlantic teams, who play lots of games against the two weak Ontario teams and the extremely weak Sabres? Continue reading
Those of you who have worked with Behind the Net data would be the first to say it’s a great, important site. I feel the same way, but I also know that anybody that’s worked with it close enough knows that there is a bit of a pain-in-the-ass there, with the different name spellings. Also, there are some position discrepancies and, for those that like to look into that sort of thing, player ages aren’t on there. Well, because I just brought the data together for something else I’m working on, I decided to share what I had for those problems. This link is to a Google doc that has the Season, regular Player Name, their age and position that season, and their BTN name for that season.
The players include all players that played a season from 2007-08 up to last week Thursday, 2013-14. Let me know if the link below doesn’t work:
BehindtheNet.ca Player Name Converter, plus Age and Position, 2007-08 through 2013-14
Hope this helps, happy researching!
