
Every once-in-a-while I will rant on the concepts and ideas behind what numbers suggest in a series called Behind the Numbers, as a tip of the hat to the website that brought me into hockey analytics: Behind the Net. My ramblings will look at the theory and philosophy behind analytics and their applications given what is already publicly known, keeping my job safe while still getting to interact with the public hockey-sphere.
Hello. Hope everyone is enjoying my return after a long hiatus. I am back from my busy schedule of helping run a tracking company that sells private tracking data to argue here against overvaluing private tracking data (and in addition black-box models)… or really I’m suggesting to not underrate what’s in the public.
You heard that right. The guy that has vested interests in demonizing public models and data is going to defend public models and data!
ACCURACY AND PRECISION, BIAS AND SAMPLE SIZE
Commonly, critics of modern public statistical models point to individual shot locations that disagree with the NHL public data. NHL data is indeed imperfect. However, when criticizing what’s available the better questions to ask are: is it imprecise? Or inaccurate? Or both?
And what does that even mean?
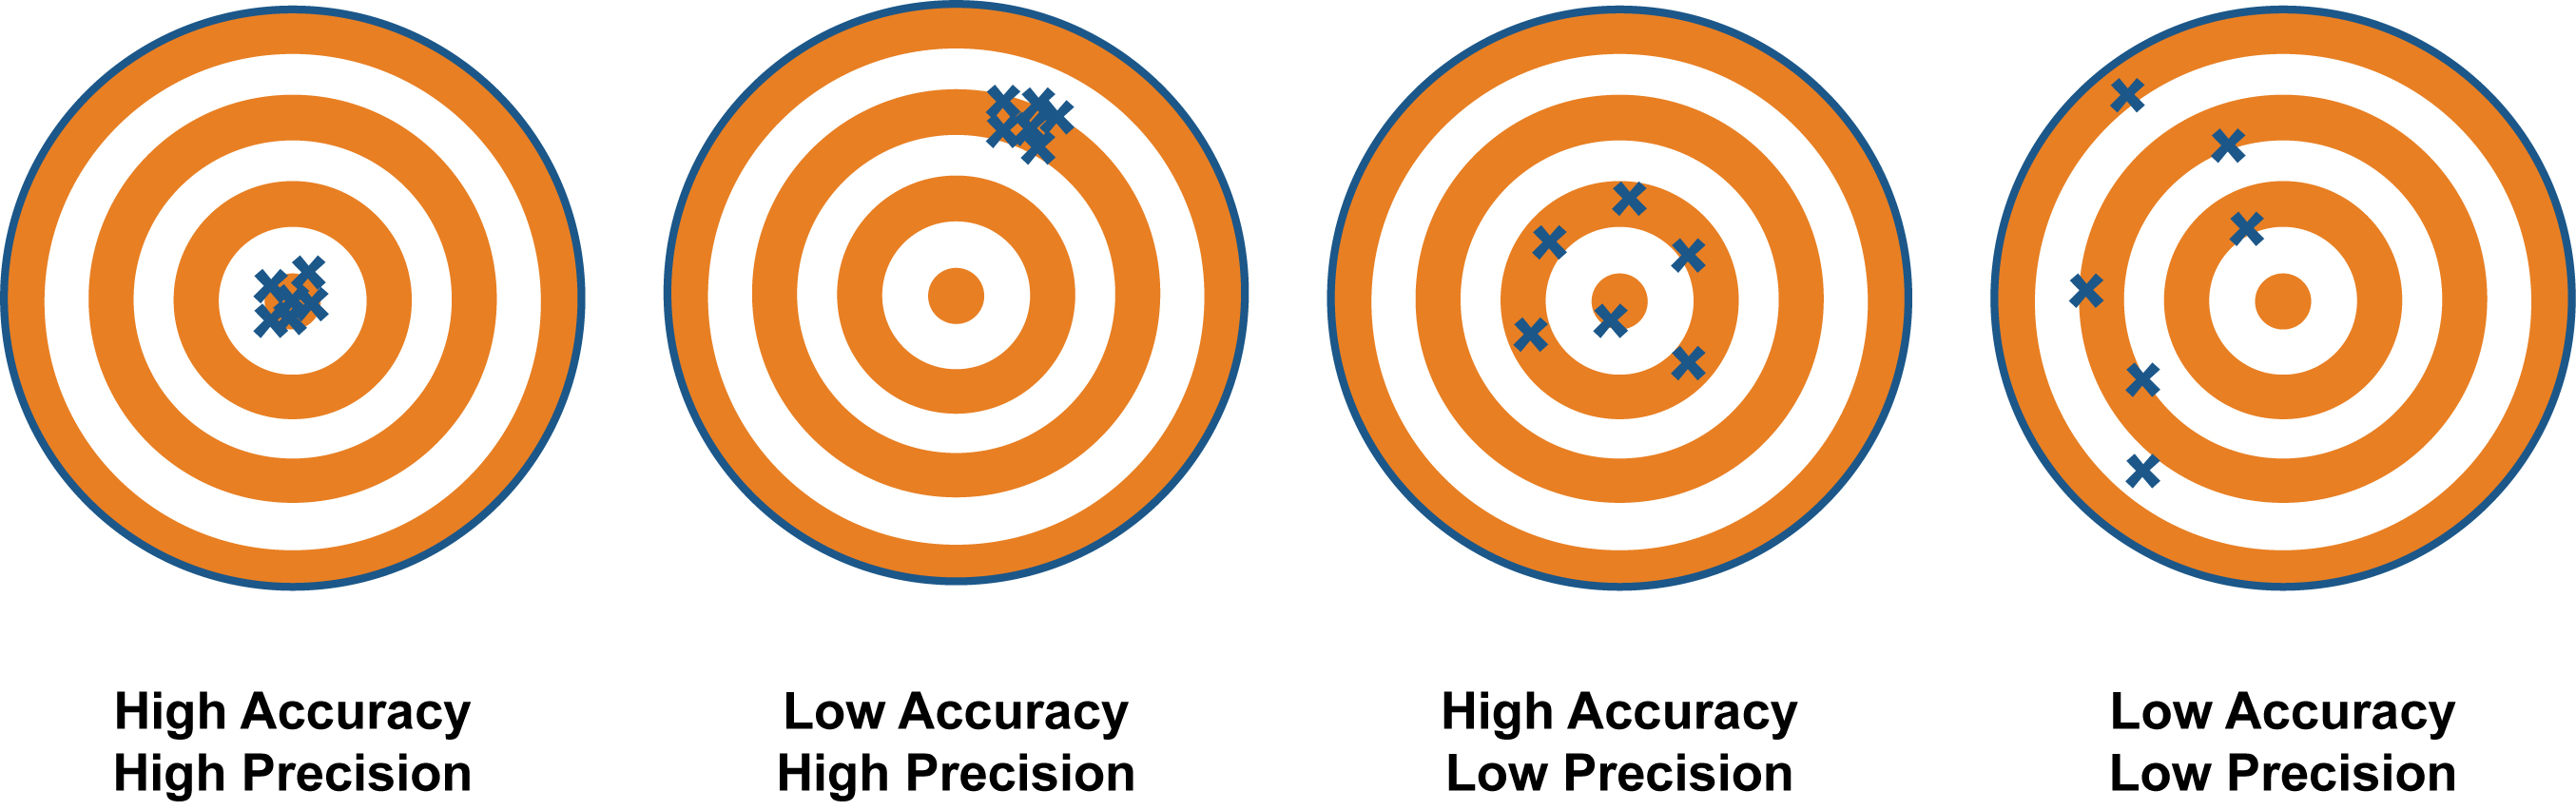
While colloquially the words are often interchangeable, their meanings differ statistically. Accurate means the data is correct on the average, even though it may or may not be right in each case. Precision has more to do with consistency of how often you are right.
Both create issues in modelling but neither are insurmountable issues.
When data struggles with precision, one only needs large enough sample sizes for the data to reflect the truth. Errors in the data exist, but they distribute randomly. Maybe a scorer puts a shot at the point a foot to the right, and sometimes they put the same shot a foot to the left. Each shot is wrong, but over the season they are on average at the right spot.
When data struggles with accuracy, one only needs to push the data in the direction of truth. Errors in the data exist, but with accuracy issues there is a consistent pattern to those errors. One example is home scorers bias; there is a trend for trackers to bias results in favour of the home team. Maybe a scorer tends to place the home shot from the point one foot in, while they place the away point shot one foot out. There can also be scorer error tendencies at one particular venue relative to others.
Many public models and statistical sites already use methods to help adjust for and limit these problems with the NHL’s data.
The difference between public and private NHL data isn’t often an argument of wrong versus right. Public data indeed has accuracy and precision issues, but the results are still based on real events that occurred on the ice. Private data improves things, marginally, in creating smaller confidence intervals, becoming statistically meaningful sooner, and needing fewer adjustment methods.
These improvements matter for competitive edge. But for a fanalyst grading players at the season’s end, you are not missing the whole picture, just some of the details.
Recently, The Point, which uses SportsLogiq private data commonly used by many NHL teams, posted their front runners for the Vezina using a Saves Above Expected model. The model outcome on top goaltenders was similar to top goalies by public models generated by public data in all three sites moneypuck.com, hockeyviz.com, and evolving-hockey.com.
PARETO’S PRINCIPLE OR THE 80/20 RULE
Now there is more to private data than just “more accurate data.” Private data offers much greater granularity, allowing for refinement of models and more information. More information gives more context and nuance in player deployment and superior shot quality measurements for things like expected goal modeling.
The extent to which these things are better doesn’t scale 1:1 with the increase in data size, though. Why is that?
I’m not sure when I first heard of Pareto’s Principle or Power Law Distribution. Whether it was in my economic or statistic classes in undergrad, or even before then. Many of you likely know the concept as the law of diminishing returns or the 80/20 rule. However, it was actually Greg Nuckols talking about this concept with strength training in his two e-books The Art of Lifting and The Science of Lifting (aside: good books, would recommend!) that really got me thinking about how this applies in hockey analytical data and models.
The basic concept is that one gains the most value from initial investment, and with each additional investment you garner exponentially less marginal increase in value.
We’ve seen this time and again. When people started looking at whether or not good things happen with a player on the ice, they already started with the right question. The rest was refinement. The transition from goals, to scoring chances, to shots, and then expected goals was simply refinement. The adjusting for score, venue, and arena context was simply refinement. The adjusting for environmental factors such as usage, competition, and linemates was simply refinement.
Hockey Graph’s own Alex Novet even already showed that the returns of adding passing and other data only marginally improves expected goal models.
This may be difficult to understand at first. You added so many things that should matter a lot! Whether or not a pass occurs before a shot should dramatically improve the chance of a goal happening, so why doesn’t it have just as large of an impact on an expected goal model?
There are many reasons, but one way that helps explain this is talking about how different variables correlate. While every case is different, most hockey players who are “good” are generally better at most things than players are “bad” (relatively speaking). To the extreme, the average shot with Connor McDavid on the ice was far more likely to go in than the average shot with Donald Brashere on the ice (10% vs 4%).
Are shots with McDavid on the ice closer on average? Are they from better angles? Being taken by better shooters? From passes that force goaltender movement? More likely to get a rebound? Etc. etc.
The truth is likely some combination of all of the above.
Good players that drive high quality shots are generally good at getting many types of good shots, and they are good enough to also garner more volume of shots in general. There’s a lot of correlation between the different variables that impact shot quality. Because of this when you account for one shot quality variable, you are already partially accounting for the others.
BETTER IS STILL BETTER
Do not simply dismiss public models simply because the private models are better. They may show a smaller part of the total picture, but they are still showing part of the picture. They are not painting an entirely different picture altogether.
There is no doubt better is still better. The entire purpose and value in private data is superior accuracy and precision with far greater granularity. This has value and there are reasons why NHL teams should invest in that value. Also, there’s a huge increase in utility with superior and more granular data in breaking down the game and looking into the nuance, environmental context, and how to properly take action based on the data.
Data is for much more than simply estimating player overal impact and saying which player provided more value than the other.
Morals of the story:
- Good private data is superior to what is currently available in the public.
- Inferior does not mean bad or useless.
- Public data is not based on made up events; these things still happened.
- The superior utility of private data comes from value beyond accurately and precisely measuring a player’s overall impact.
