

By MithrandirMage [CC BY-SA 3.0], via Wikimedia Commons
Every once-in-a-while I will rant on the concepts and ideas behind what numbers suggest in a series called Behind the Numbers, as a tip of the hat to the website that brought me into hockey analytics: Behind the Net.
Hey! Remember me?
I work full-time for (slash help run) HockeyData, a data tracking and analysis company. Because of this conflict of interest, it limits what I can and cannot talk about. The good news is I can still talk generalities, the basics behind analytical thinking in hockey, and other peoples’ good work, which fits my Behind the Numbers series.
Why have there been so few updates then? Been busy (…lazy).
One generality I’d like to rant about is how we look at and evaluate statistics and models: how meaningful different numbers are and why we view them that way.
My Model is Wrong and That’s Okay
I’m going to start off with a little quote from George Box that I enjoy:
Now it would be very remarkable if any system existing in the real world could be exactly represented by any simple model. However, cunningly chosen parsimonious models often do provide remarkably useful approximations. For example, the law PV = RT relating pressure P, volume V and temperature T of an “ideal” gas via a constant R is not exactly true for any real gas, but it frequently provides a useful approximation and furthermore its structure is informative since it springs from a physical view of the behaviour of gas molecules.
For such a model there is no need to ask the question “Is the model true?”. If “truth” is to be the “whole truth” the answer must be “No”. The only question of interest is “Is the model illuminating and useful?”.
The final sentence summarizes the basics of testing statistics in hockey. All a statistic needs to do is tell you something useful in analyzing the player and/or team. Comparatively speaking, if two statistics are trying to tell you about the same thing, the one that is accurate more often is the superior one.
But how does one determine that?
The Three Tests of a Good Stat
There are three basic ways we analyze statistics: in sample correlation, autocorrelation, and out of sample correlation (FYI: the true definition of analytics is the computational analysis of statistics… statistics and analytics are not exactly synonymous).
In Sample Correlation
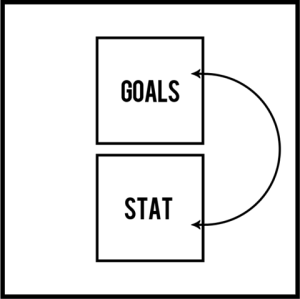
The first and simplest way we analyze a statistic is in sample correlations: how two numbers relate in the same sample.
Generally speaking, the two numbers we compare are the statistic in question and goals, since outscoring is the ultimate objective to hockey (no, really). We look at how these two stats compare within the same set of games.
This process helps you understand whether the stat succeeded in the past. How often does the team with the most shots win? How often does the team that scores a power play goal win? How often does the team that wins more face offs win? Etc.
This type of analysis is helpful, but not sufficient to prove a stat works well. There are dangers to limiting yourself to this level of analysis because one can overvalue a relationship. This is commonly a source of overfitting, which could be seen with SAP’s 85% accurate prediction of NHL’s playoffs.
For example, this type of analysis would show goals have a stronger relationship to wins than Corsi. The reason for this is because goals are what causes wins. The reason why we care about Corsi comes from a different type of testing. This tells you is that goals are what causes a team to win… (audible gasp!)
Autocorrelation
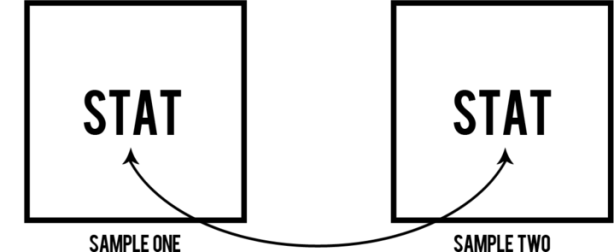
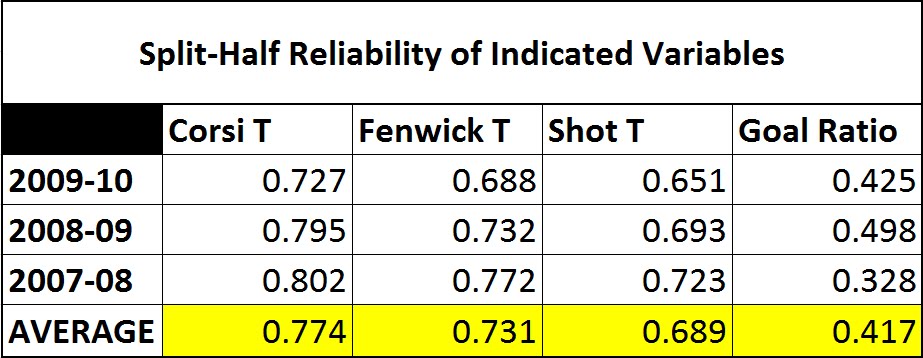
Autocorrelation is the next level and observes how well a statistic relates to itself in the future. This is also known as its repeatability, although there are other statistical testings for repeatability.
The purpose of this test is to see how much of the player’s or team’s performance in that area is driven by the individual subject.
It is the statistical equivalent of you saying “Bet you can’t do that again!” to a friend after making some trick shot in hoops. Repeatability matters because if an objective is desired and strived for, success must be repeatable if the subject has control over the outcome. If your friend consistently makes the same shot, then it’s unlikely luck. If your friend fails after multiple retries, then it may have been a fluke.
One can split up the samples many ways. We can look at a statistic’s autocorrelation from one season to the next, from any part of a season to the rest, or split the season into pieces (example: odds versus even games or random 42 versus the remainder). We can also split between the two different teams for all players that have been traded or signed to a new club.
Again looking at shots and goals, we see that shots tend to have a much higher autocorrelation than goals. What this means is that its easier to be consistent in outshooting than outscoring. This suggests that teams have more control over shots than goals.
Out of Sample Correlation
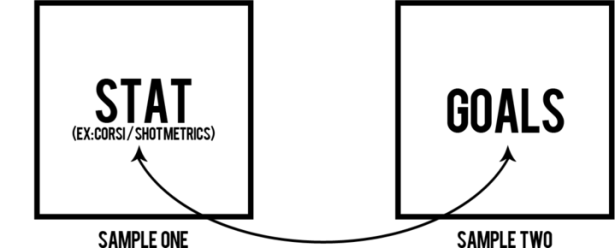
Out of sample correlations splits the sample, like autocorrelation, but looks at the relationship between two different statistics, like in sample correlation. This is the final and most important layer of analysis. This is looking at “predictiveness.” Once we know a stat is repeatable and related to goals in the same game, this tests whether the stat will help us figure out who will score goals in the future
For example, this is the same type of analysis Tore Purdy conducted that help push the Corsi statistic to the forefront.
Predictiveness matters. Signing or trading for players that outscored their opponents won’t matter if they do not continue to do so. Betting on a team that has been winning won’t matter if they do not continue to do so.
What? Corsi is Evolving!

Expected Goals, Corsi, and Goals predicting future 5v5 outscoring by DTM About Heart and Asmean
Now that we have some tools for evaluating statistics, let’s use them while looking briefly the history and evolution of hockey statistics.
The most famous and popular number to come out of hockey’s “advanced statistics” is Corsi.
Corsi was never intended to be a holistic number or a WAR-type statistic. It was merely brought in to try and measure an area of the game not yet being accounted for with goals, assists, and other statistics then available. It was shown to predict future success better than goals and comparably to scoring chances (but without the need to be manually tracked, like scoring chances).
Corsi was like baseball’s on-base percentage: it did not account for everything, but it illuminated an understudied part of the game. It was extraordinarily useful because it was predictive of success and also undervalued. You could use it to learn more, and you’d gain an advantage over your opponents.
We did not use Corsi over other statistics like plus/minus for arbitrary reasons. We cared because we tested them, and Corsi performed better.
We then improved upon this statistic. We adjusted Corsi to account for confounding variables like score and venue effects. We adjusted shots for the shot quality variables we can account for, like shot location, player situation, and shooter history.
The next step after that was creating player value models based of these, and other, statistics. GAR translated different statistics into one currency (goals) in order to compare the relative importance of different areas of the game: scoring, shot differentials, shot quality, penalties, etc. Again, these models became important only because they showed to be superior in either illumination or usefulness.
Sometimes people use the argument that ‘statistics are not the whole picture’ in order to belittle numerical analysis. Personally, I think that’s an argument in favor of statistical analysis. Statistics paint a part of the picture, some of which you’d miss if you ignored what the stats say.
With each step in evolution, we can account for more and more of the total picture. We know this because we have tested their predictivity every step of the way.
Hockey has Randomness, so a Good Stat should Never be Perfect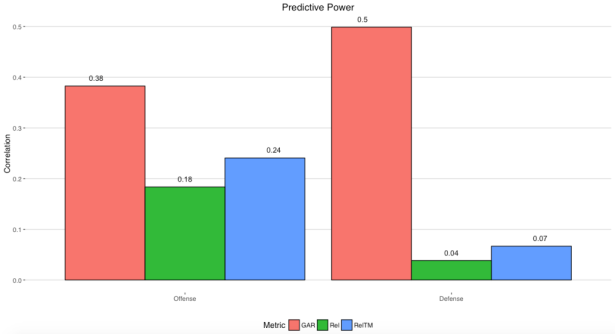
GAR, Corsi Rel, and Corsi RelTM predicting future 5v5 outscoring by DTM About Heart (the original article since gone with his hiring)
Goals have a lot of natural variance. They are rare enough and have enough confounding variables to look and act random, even in a sample as large as a full season.
Most people who follow hockey analytics understand the consequences of goal socring’s randomness, at least up to a point. They understand that this is why goal metrics tend to be inferior to shot metrics (like Corsi, Fenwick, and expected goals).
However, there is an issue often overlooked. It diminishes the strength of relationship limit.
As we noted, goals are the object we generally try to predict in out of sample correlations. But as we also noted, goals have a lot of “randomness” mixed in with the talent portion.
When you build a model that is supposed to measure player talent or performance level, you want it to predict future outscoring well, because good players are more likely to do well in outscoring. However, when you are trying to predict something that is in part “random” (ie: not controlled by that individual player), you are not wanting to actually predict the success that is not controlled by that individual.
Take for example the above GAR graph. Even Strength Defensive GAR had a 0.50 correlation with even strength goals against (when given ice time). That strength of relationship is not the strength between EV Defense and player impact on goals against, but between EV Defense and the goals against those players observed (which is a mix of player impact and outside variables) and aggregated into their respective teams.
This is why relative strength matters so much. GAR was a huge step forward from Rel Corsi or RelTM Corsi, but we do not expect a high-end, >90% correlation. You are predicting variables that have luck mixed within.
For example, Gabriel Desjardins used one method and estimated that about 38% of standings is driven by luck. Josh Weissbock later conducted a different experiment and found the exact same percentage (well… 37.6%). In theory then, the actual limit to predicting a team’s outscoring would be around 62% with a “perfect” model.
Generally speaking, there is more luck involved in a single player’s results versus a team’s results due to the much smaller sample size. Which is in part why the correlations of the two previous graphs I posted above cannot be directly compared.
That 50% correlation for EV Defense GAR does not account for 50% of the whole picture but about 50% of the observed results, while about 38% of the observed results is likely accounted for by randomness. The percentage of the picture being missed is much smaller and closer to 12% than 50%. The math doesn’t actually work this way, but it gives you a general idea of what is going on here.
Twelve per cent means a lot is still missing from the full picture, but it is small enough to for the model to be an extremely powerful and effective tool.
Closing Thoughts
Public hockey numbers have evolved. They are more powerful than ever before, and we consistently strive and critique to drive that process forward. Their performance is actually quite impressive, especially given the limitations of using the NHL’s available data. It also shows that –despite the accuracy, bias, and precision issues with NHL public tracking– there is a lot of legitimate value in that data.
This just gives a glimpse to how powerful these models could be with adding more layers of granularity (example: passing and zonal transition data) and improved accuracy and precision.
If you are uncertain of someone’s inferences and their numbers, ask them some questions. Ask them to show their testing results. Ask them for their training and testing samples.
The numbers we use to evaluate hockey are not selected arbitrarily. They are chosen because they have proven to be useful.
Pretty visuals courtesy of Mike Pfeil.

I work as an Engineer, and a lot of my job requires making numerical models of systems. Our shorthand comment about models is basically the same as the quote at the beginning: “All models are wrong, some models are useful.”