Friday Quick Graphs: Marginal Gains for Forwards

Screen Shot 2017-01-19 at 1.30.05 PM.png

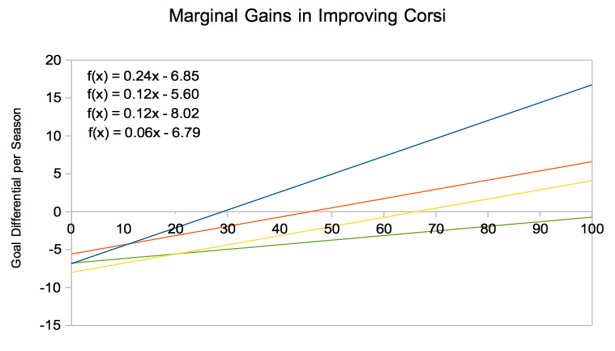
How many goals is improving a team’s first line worth versus your fourth line?

The above graph shows the number of goals over a season a team should expect in improving their player’s shot differential talent, here described in percentiles of talent.

The blue line is first liners with 2nd, 3rd, and 4th liners falling next with red, yellow, and green.

The blue line is the steepest, suggesting that moving from a 55th percentile player to 60th percentile player on the top line will improve a team’s goal differential by about twice that of a 2nd or 3rd line player. (This is not to be confused with improving from a 55% Corsi player to a 60% Corsi player)

What is interesting is that the marginal gains in improving a 2nd line player and 3rd line player is about equal.

The next question one should ask is: what are the costs in salary and cap hit for making said improvements?

Method:

  1. All forwards over all available full seasons were sorted by 5v5 TOI/GP
  2. Players binned into four groups of equal number of games played
  3. Each bin then sorted by Corsi%, and binned into percentiles
  4. Goal differentials are extrapolated to full season given average TOI per season for each line (so differing rates in injuries and pressbox banishment is being included)

Behind the Numbers: Scoring first and conditional probability

Every once-in-a-while I will rant on the concepts and ideas behind what numbers suggest in a series called Behind the Numbers, as a tip of the hat to the website that brought me into hockey analytics: Behind the Net.

Not long ago Jason Gregor tweeted about the value of scoring first.

It may be a bit controversial and difficult to get right away, but the value of scoring first is not special. Long ago, Mr. Eric Tulsky, now of the Carolina Hurricanes, showed that the value of scoring first equals the value of any other goal.

Continue reading

Behind the Numbers: Why Plus/Minus is the worst statistic in hockey and should be abolished

Embed from Getty Images

Every once-in-a-while I will rant on the concepts and ideas behind what numbers suggest in a series called Behind the Numbers, as a tip of the hat to the website that brought me into hockey analytics: Behind the Net.

Hockey’s plus/minus may be the worst statistic in hockey, although there is some debate with goalie statistics not based off of save percentage (like GAA or Win% that just adds a team component to a goalie’s save percentage). It could even be in contention for just the worst statistic in sport.

Now, some people may read that and think I’m simply saying this because I value shot metrics over goal metrics in player evaluations. While I do feel that way, it is only one of a few reasons that that plus/minus fails in being useful.

Continue reading

Hockey Graphs and Vancouver Canucks Co-Host Vancouver Hockey Analytics Conference 2017


cvoxhjuueaa8rh1-jpg-large

Hockey Graphs is excited to announce that we will be co-hosting the Vancouver Hockey Analytics Conference (#VanHAC) with the Vancouver Canucks along with HockeyData and Canucks Army.

Date: Saturday, March 11th, 2017

Location: Rogers Arena, Vancouver, Canada

Website: HockeyGraphs.com/VanHAC

The call for speakers is currently open with a deadline of January 10th, 2017.  See the website for more details or go here to submit your submission.  

Registration has yet to open as we tabulate the final costs to host the venue, among other factors. Check back here or on Twitter for more information when it will open. (Note: Expect participants to be capped at around 100 people.)

Watch the VanHAC page for updates as they are released!

Behind The Numbers: On the World Cup and Team Canada’s domination

Embed from Getty Images

Team Canada won the cup. Team Canada went undefeated. They were the favourites going in, and they came out the winner. Not only did they win, but they went about it in dominant fashion. They rarely trailed and they controlled nearly every facet of the game.

It wouldn’t be surprising for many to hear that the team also dominated in the shots column… but they were not the most effective team in every aspect, which raises some interesting questions.

Continue reading

Behind the Numbers: Why statistic-folks are sometimes assholes, UNjustifiably

Every once-in-a-while I will rant on the concepts and ideas behind what numbers suggest in a series called Behind the Numbers, as a tip of the hat to the website that brought me into hockey analytics: Behind the Net.

Here we go. Here is part two, to what really should have been part one in hindsight prior to this piece, which would have saved me some of the backlash on Twitter, as the point was frequently misunderstood. (And while we’re dealing with hindsight, the title was part of the misunderstanding as well.)

Continue reading

Behind the Numbers: Why statistic-folks are sometimes assholes, justifiably

Every once-in-a-while I will rant on the concepts and ideas behind what numbers suggest in a series called Behind the Numbers, as a tip of the hat to the website that brought me into hockey analytics: Behind the Net.

It does not take long for Hockey Twitter to complete one full rotation on its typical life-cycle of subjects. The same debates come up on shot quality, grit and leadership, eye-test versus numbers, and how statistics should be used in player evaluation again and again.

These debates often come to an impasse. Sometimes they even deviate into ad hominem and red herrings. There are parties guilty on both sides, as one would (and should) expect there to be “assholes” in every demographic.

But why is the prerogative for being nice always on the “stats guys”? Why are the “analytics guys” the only ones needing to change their ways to make things better? Why is it that only one side is discussed to be less cordial than the other?

Why does this hypocrisy exist?

I have a theory on this.

Continue reading

Behind the Numbers: Results matter in the end

img.jpg

Every once-in-a-while I will rant on the concepts and ideas behind what numbers suggest in a series called Behind the Numbers, as a tip of the hat to the website that brought me into hockey analytics: Behind the Net.

Player tracking, what is it good for? Absolutely nothing.

Okay, that’s a lie. A catchy lie though, especially if you are into late-60s / early-70s soul. It would also be pretty disingenuous of myself, since helping run the technical side of a tracking company is my day job.

However, whether you call it individual player tracking, microstatistics, or whatever, there seems to be some misunderstanding to some on what the numbers being measured represent and what they should do with this information.

Continue reading

SEAL-Adjusted Scoring and why it matters for prospects

While the primary focus of the hockey analytics community has been around roster optimization, there has been a small subset of the community that has worked a great deal on prospect analytics. This includes the work of Gabriel Desjardins’ on NHL Equivalent scoring, Josh Weissbock and Cam Lawrence’s work on Player Cohort Success (since purchased by the Florida Panthers), and Rhys Jessop’s work on adjusted scoring metrics.

As a big fan of prospect scouting and analytics, I wanted to add to the community by expanding upon the work done by Jessop.

Continue reading