Last Friday we asked how many goals is improving a team’s first line worth versus their fourth line? What about defenders?
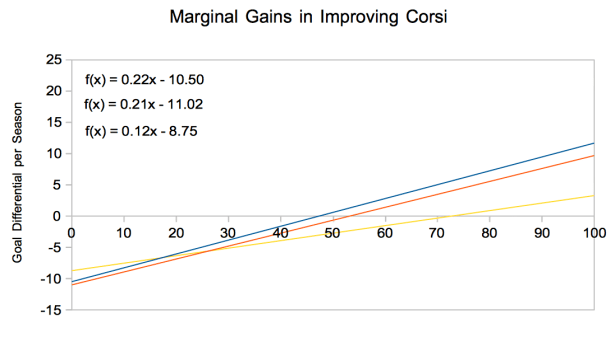
The above graph shows the number of goals over a season a team should expect in improving their player’s shot differential talent, here described in percentiles of talent.
The blue line is first pair with 2nd, 3rd, pairs falling next with red and yellow.
The blue line is the steepest, suggesting that moving from a 55th percentile player to 60th percentile player on the top pair will improve a team’s goal differential more so than a second or third pairing player. (This is not to be confused with improving from a 55% Corsi player to a 60% Corsi player)
Notice how the difference between the top and middle pair is pretty negligible. Improving from an average (median, 50th percentile) to the absolute best in both top and middle pair defenders is only about half a goal difference in improvement. This effect may be due to the fact that teams often place their second best defender on the second pair, whether that may be due to strategy and design or due to handedness “forcing” the team’s hand.
A reminder that the coefficients we found for forwards were 0.24, 0.12, 0.12, and 0.06. This may seem to suggest improvement should be concentrated for top forward line, followed by the top-four defenders, and then middle-six forwards with the bottom pair. However, our method is agnostic of usage and who drives shot differentials more, forwards or defenders.
