Much of the gains made in the field of hockey analytics has to do with player evaluation and roster construction. Identifying and quantifying a player’s on-ice shot differential while accounting for the context (score state, quality of teammates, quality of competition, deployment, etc.) is something the community has largely been successful at doing. When teams sign or trade for a player, we’re at a good enough place to determine if that was a positive or negative signing, for the most part. There have even been improvements in scouting and drafting that are analytical in nature.
However, we still are lacking in areas of quantifying a team’s system and how they play. We have made strides concerning two important phases of the game, namely the work done here on zone entries by Eric Tulsky, Geoffrey Detweiler, Robert Spencer, and Corey Sznajder, and also work done here by Jen Lute Costella on zone exits. These two pieces, among others written on these subjects, demonstrate a data-driven approach that can influence the tactical decisions a team can make on the ice. However, these are isolated incidents at the blue lines and structured play in the offensive zone remains difficult to quantify.
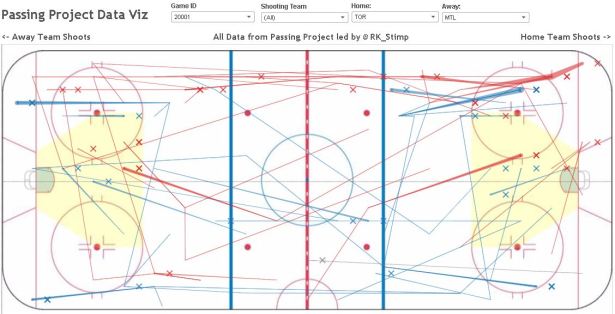
I attended the NHL Coaching Clinic held in Buffalo, NY the day before this year’s draft. During a presentation from Davis Payne, an assistant coach with the Los Angeles Kings, I noticed two distinct plans of attack being demonstrated and wanted to quantify them as best I could with our passing data. The decision on how to set up and attack in the offensive zone is largely determined by the coach. They will establish a structure within which their players have some latitude to create offense. Rarely do we see this aspect of the game quantified as it’s incredibly fluid and difficult to pin down. However, today we’re going to do just that.