
At the Rochester Hockey Analytics Conference, Stephen Burtch presented on Network Analysis using our passing data from last season. You can access Stephen’s slides here. It was an intriguing presentation on how we can use the passing data to better understand the on-ice environment of players and teams. If you’re at all familiar with my work, you won’t be surprised to hear me say that what happens prior to a shot being attempted is something that escapes us and is more important than just the final act of shooting. Only in better understanding how things happen, or don’t happen, prior to that, will we be in a better place to properly evaluate players. When Stephen presented at #RITHAC, I was sitting there thinking, “Boy, this would be great to do with the 2015 OHL Final Passing Data” I’d tracked, but hadn’t gotten around to sharing the results.
It’s no secret we lack even basic data in the junior and collegiate leagues. This makes scouting and evaluation exceedingly difficult once you get past the first few selections in the first round. In fact, one of the things our passing data uncovered last year was that Tyler Johnson, of all players that we tracked for at least 200 minutes (382 players), generated scoring chances from his passes at the 4th highest rate of those players. Now, had data like this existed at the lower levels, his play-making ability could have been quantified and, perhaps, he would been drafted. It was this idea that led to undertaking and completing this side project in August to see if tracking a playoff series – the 2015 OHL Final between Erie and Oshawa – would offer new levels of insight into junior players. It might inspire some people to offer to track junior games. Hard numbers would enhance a scout’s evaluation of a prospect. With no process in place to offer these types of numbers, we are better off attempting to predict a prospect’s success using comparable attributes among players.
The 2015 OHL Final was decided in five games with the Oshawa Generals advancing to the Memorial Cup. This post will be the first in a short series looking at several aspects of how we can use this data to analyze the game. Do keep in mind that data across five games is hardly authoritative, but, well, we’ll come back to this. We’ll begin by looking at the passing network for the Erie Otters.
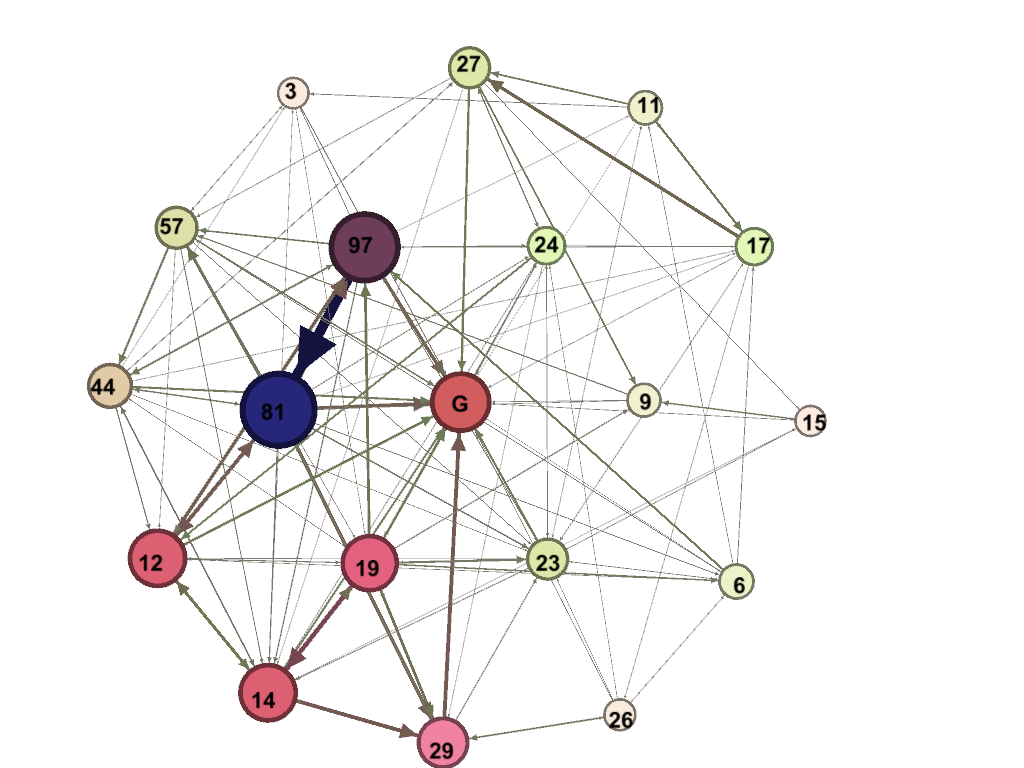
I’ve basically recreated what Burtch did at #RITHAC using Gephi. You’ll see the central node of G as the opposing goal, so this network visualization captures passes and shots. The larger and darker the node (player), the higher number of edges (connections or passes) to another player or goal (shots) that player had. Rather than simply total up the passes and shots, I’ve assigned weights based on whether that pass led to an actual shot on goal, was a scoring chance, was a danger zone pass (from behind the end line or across the Royal Road), resulted in a goal, etc. So, over the course of this series, the Otters’ Remi Elie and Connor McDavid were the most dangerous players by far. The edges (lines) between players are weighted as well, so that thick arrow from McDavid to Elie is the result of McDavid setting up several chances from behind the end line. However, Elie’s Weighted Out Degree (Weight of passes sent to other players) was still slightly higher than McDavid’s. So, Elie can certainly dish it as well.
Using similar Centrality measures as Burtch did at #RITHAC, let’s have a look at the Otters’ Network.
Betweeness Centrality
We’ll begin with the Betweeness Centrality. Betweeness simply measures how often a node appears on shortest paths between nodes in the network. Basically, how many players does this particular node have a connection with?
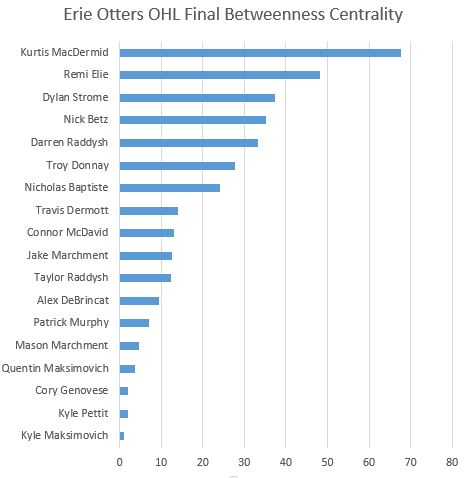
So, defenseman Kurtis MacDermid was the most well-traveled node on the graph. This isn’t surprising as defensemen will typically make defensive zone and neutral zone passes to forwards as they break out and regroup. MacDermid was essential to springing the Otters’ attack on numerous occasions, often by simple, effective plays likes these.

The puck has come to MacDermid, who is under pressure from Oshawa’s Aidan Wallace.

MacDermid makes the pass to Kyle Maksimovich, who is able to split the pressure of Michael Dal Colle and the Oshawa skater coming onto the ice in front of Maksimovich.

As Maksimovich swung in, Taylor Raddysh swung out, creating the open space for himself as Dal Colle pressures Maksimovich. This led to an entry and a good chance by Raddysh.

Another regroup. MacDermid is now being pressured by Cole Cassels. He has Remi Elie cutting across the neutral zone, but if it’s not a perfect pass, Cassels could intercept or deflect it.

MacDermid waits and Cassels opens a passing lane for MacDermid to hit Elie for another controlled entry.
It’s the simple plays like that which show how effective a defenseman can be. MacDermid is tops on the list for a reason. While fellow defenseman Travis Dermott makes an impact via his passing, it’s in the simple plays like those described above that explain the gap between these blue liners.

Here’s Dermott with loads of space and plenty of options on this breakout.

Dermott basically skates right into the pressure and has to turn back.

The end result is going from control of the puck to a needless board battle in which possession is up for grabs.
Had this been a full season’s worth of data, we may see McDavid higher on the list as being the most integral to the Otters’ attack, the fact that he is not on top of this data from a five-game playoff series tells us a few things.
1) He’s Connor freaking McDavid and sometimes he doesn’t need teammates. Like this.

2) It tells us that Oshawa was somewhat effective in limiting his influence. McDavid’s numbers for Games 3 and 4 (home games) were impressive: he contributed to twenty-two shot attempts and completed sixteen passes that were part of shot sequences for the Otters. His numbers for Games 1, 2, and 5 (away games)? Only six more total contributes and only three more total passes. So, McDavid contributed at much lower rate away than at home. How could Oshawa be more that much effective with the last change and their game-planning against McDavid?

Here’s McDavid leading the breakout for the Otters.

As he exits his zone, Oshawa’s Bradley Latour comes over in an attempt to apply pressure. McDavid is not so easily fooled.

McDavid makes a move back inside and this triggers the second forward to step up and apply pressure. Oshawa was aggressive in the neutral zone throughout the series, but especially at home. McDavid has to skate wide to enter the zone, which he does under control.

McDavid enters, but Oshawa gives him nothing. For the games at Oshawa, McDavid was regularly greeted by a wall of red. As I mentioned above, Oshawa had great success at home denying clean zone exits and applying pressure on the breakout. Here is a longer series.

Here, we see the forwards circling in and out of the zone, walling off options as Erie attempts to breakout. They are turned back once and then, on their second successive attempt to exit the zone, send a hopeful pass that is deflected out.
The Betweeness Centrality measure illustrates how McDavid’s impact was relatively stifled compared to other forwards. Oshawa wasn’t going to let him take them apart and so this opened up more space for Elie to get involved.
Weighted Degree
This is what I referred to earlier: weighting the passes and shots that the players are involved in to better represent levels of danger in their linkups.
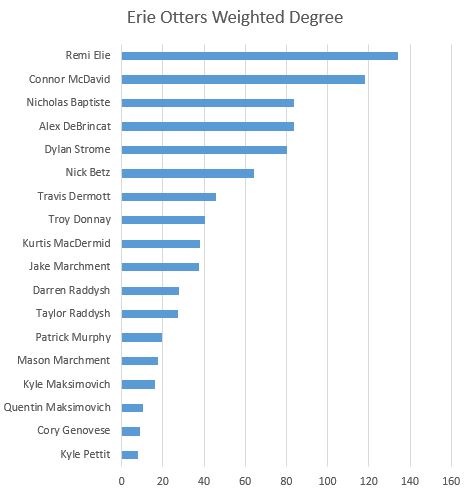
Elie sits on top as his contributions had the highest aggregate weight. Elie had a knack for delivering a killer pass, but also getting open to receive and them.
Here he gets open and hammers McDavid’s one-timer pass past Ken Appleby.

And here he makes a quick stretch pass that starts a 2-on-1 and leads to the opening goal in Game 5.

So What?
There are practical reasons for wanting additional data and analysis to be done in this fashion. The first and most obvious is to properly evaluate players in scouting. I go back to the above example of Tyler Johnson. Being able to quantify additional skill sets is essential to ascertain what a player will/will not add to your organization. It also offers more insight in the type of role he or she will excel at.
Secondly, looking at data in this manner offers elevated opposition analysis. To take data, analyze it, and then create a tactical approach designed to take advantage of weak points in the opposing lineup or system…this is something that is lacking in the hockey analytics community. It’s one thing to look at the end result (shot attempts) when a player is on the ice, but it’s another thing entirely to have the knowledge to alter that end result. This is where most of my work will be this season: taking our data and applying breakdowns of how teams play, where they are successful, and where they can be beaten.
Earlier, I mentioned data over a five-game series is hardly authoritative and that’s always going to be true. That doesn’t trivialize the impact proper opposition analysis can have over that series. There are always going to be strong, random effects in smaller samples, but using data to put your players in the best spot to succeed can certainly help to mitigate the randomness associated with hockey.
Limitations
There are some concerns with passing networks in hockey as opposed to soccer. In soccer, all players are on the field throughout the match, whereas in hockey, many players will spend little time with one another. Large enough samples might be enough to overcome this, but it should at least be noted.
Next Time
I mentioned this playoff series would result in a short series of posts and the next one will take a deep dive into the Erie players before moving onto Oshawa. Thanks for reading!
