
Much of the gains made in the field of hockey analytics has to do with player evaluation and roster construction. Identifying and quantifying a player’s on-ice shot differential while accounting for the context (score state, quality of teammates, quality of competition, deployment, etc.) is something the community has largely been successful at doing. When teams sign or trade for a player, we’re at a good enough place to determine if that was a positive or negative signing, for the most part. There have even been improvements in scouting and drafting that are analytical in nature.
However, we still are lacking in areas of quantifying a team’s system and how they play. We have made strides concerning two important phases of the game, namely the work done here on zone entries by Eric Tulsky, Geoffrey Detweiler, Robert Spencer, and Corey Sznajder, and also work done here by Jen Lute Costella on zone exits. These two pieces, among others written on these subjects, demonstrate a data-driven approach that can influence the tactical decisions a team can make on the ice. However, these are isolated incidents at the blue lines and structured play in the offensive zone remains difficult to quantify.
I attended the NHL Coaching Clinic held in Buffalo, NY the day before this year’s draft. During a presentation from Davis Payne, an assistant coach with the Los Angeles Kings, I noticed two distinct plans of attack being demonstrated and wanted to quantify them as best I could with our passing data. The decision on how to set up and attack in the offensive zone is largely determined by the coach. They will establish a structure within which their players have some latitude to create offense. Rarely do we see this aspect of the game quantified as it’s incredibly fluid and difficult to pin down. However, today we’re going to do just that.
Payne outlined that due to how good the goalies are and how well-coached each team’s defensive systems are, creating offense is at a premium in the league. Two of his points stuck out to me as he discussed setting up “predictable structured plays” in the offensive zone – this became synonymous with players finding the “release point” within their system, a term I had not heard in this context, but understood to mean that when players were faced with pressure, they knew exactly where a teammate would be in order to keep possession. The goal of these release points is simply to create space and separation between your team and the defenders. You’ll see examples in the clips below.
The other point that stuck out was allowing players to use their skill and creativity within this structured setup. We’ll go over two of the types of attacks Payne discusses. These are Behind the Net strategy, which you’ll see the San Jose Sharks using, and the Low-to-High to Net strategy, which you’ll see the L.A. Kings using.First up, some clips from each team to illustrate what I’m talking about.
Low-to-High Plays in the Offensive Zone
One of the advantages to running a low-to-high system is what it does to a collapsed defense. Basically, when faced with a team that brings all five players below the tops of the faceoff circles, passing the puck back to the point will force one or two forwards to come out and press the points, thereby creating space behind them for passing lanes to open up.

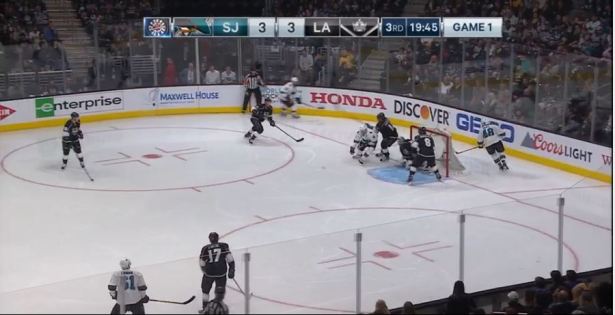
If we look here, we can easily count all five San Jose skaters. Joe Pavelski is the highest defender in the zone and he is barely above the faceoff dot. Sending the puck back to the point creates….
Space! The Kings now have options (D-D pass, shot from distance, send the puck low to cycle) that previously were not available. This is a strategy used to draw the defense out from their collapsed box and reassess options.
This is an example of going low-to-high on the strong side of the ice (side the puck is on), but play can also be switched to the weak side with a low-to-high diagonal.

The above clip illustrates the advantages of this maneuver. The Kings are not finding much room to generate offense so a well-timed pass to the weak side point creates a shot. The goal in this type of low-to-high move is to generate a clear lane for a shot that the goalie has to move to get set for, and the ability to get players to the net in anticipation of a rebound.
Payne highlighted several more clips of the Kings generating offense in this fashion, but you get the idea. Let’s move to Sharks.
Behind the Net Attack in the Offensive Zone
Cycling and playing down low are staples of Peter DeBoer’s system. An aggressive 2-1-2 forecheck, gaining possession of the puck, followed by a strong cycle game are what have made his teams dangerous. He’ll even throw in a low-to-high play and look for a high deflection now and then. Having watched him coach the New Jersey Devils for three-and-a-quarter seasons, I became quite familiar with how his teams work, but feel the behind the net attack is something he made a staple in San Jose rather than New Jersey. He did not have the high-end forward talent on the Devils that he inherited on the Sharks. While both systems are similar, there are nuances that separate his tactics on his last two teams.

In the above picture, we’re going to see the key tactical advantage of playing the behind the net. Joe Thorton will come from the weak side and circle behind the net, receiving the puck below the end line. This is a predetermined release point for the Sharks – they know a teammate will always be in and around this area that they can send the puck to maintain possession.
Notice Pavelski and notice Drew Doughty. Doughty is skating to check Thornton, but with the proximity of Pavelski and the other Kings defenders several feet away, Doughty cannot skate to check Thornton and instead must…

Put on the brakes due to Pavelski’s movement. Now Thornton has the puck and can survey the entire situation with plenty of time. Let’s see this entire play from start to finish.

You can see Thornton move behind the net to receive the puck. Most teams won’t send someone back there to check the opponent as it leaves the front of the net unprotected. It forces the defenseman to make a tactical decision of “Remain or Leave?” Tomas Hertl drives to the net and Pavelski moves across the zone, keeping the triangle shape with Thornton, and Jumbo Joe makes one move and opens the scoring.
We’ll look at one more before we get into the data as I want to impress upon the reader the commitment to this style of play.

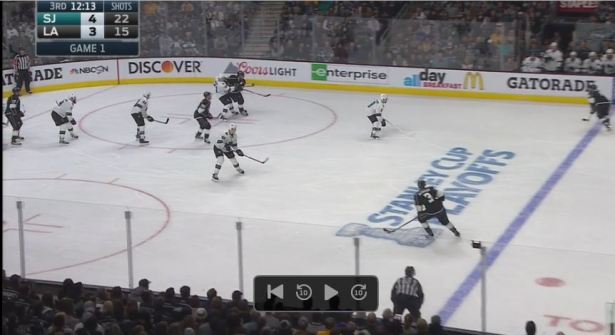
This is the game-winner from Game 1 of this series. The puck is sent down low after the faceoff is won. Pavelski corrals it and a simple wraparound wins this one for San Jose. Let’s look at a few still images to highlight how he’s able to do this so easily.

As Pavelski boxes out Anze Kopitar and collects the puck, you can see Hertl fill in behind him, below the end line. If Jake Muzzin decides to collapse down to prevent Pavelski a lane to skate in front of the net, Pavelski can simply reverse the puck to Hertl. However…

Muzzin has Thornton coming below the end line as well. The Sharks have all three forwards committed to playing behind the net. Doughty has Hertl lingering nearby, and Muzzin has Thornton in his field of vision as well. This allows Pavelski an easy chance to score.
It’s not so much the speed of the attack, but the support that creates the chance as well.
Quantifying Each System
Now, as I watched the clips Payne shared (not quite the same as above as those were not made available), I gave myself a huge pat on the back for making the decision way back last August that we would track passes that went back to the point and those that originated from behind the net. I realized that I could quantify these types of attacks to determine which is an ideal system to implement. To avoid overlap in both datasets (i.e. passes from behind the net that went back to the point) the shot assists included in the Behind the Net category omit all passes back to the point; those are included in the Low-to-High category. Let’s look at the data we’ve collected from just under 400 games this season.

What stands out is that of the shots that are on target from shot assist from behind the net, they are converted 12.8% of the time compared to shots on target from the point that are converted at a much lower rate of 4.1%. Now, the logic behind shots from the point is that a good shot will get through and also create rebounds. While it is true that 4.6% of these shots result in rebounds, you are more likely to generate a rebound scoring chances on a shot assisted from behind the net (6.4%).
To quickly recap: you are more likely to score and generate rebounds by playing behind the net rather than going through the point for offense. There is qualitative data to support this as well, summed up here by none other than the goalie victimized in this series, Jonathan Quick.
Based on the thirty-one Sharks games and seventeen Kings games we’ve tracked this season, we can measure the percentage of how the team created their offense and see how they stack up against the league numbers from the overall population.

We quickly see the Sharks way out ahead of the other teams in the league in terms of what percentage of their shots are generated from passes behind the net. Additionally, they had a large amount of their offense generated with passes back to the point. I mentioned earlier from DeBoer’s time with the Devils that a set play of theirs was passing back to the point and then looking for high deflections in the slot. It appears he’s brought this with him out west.
But what does this tell us? It tells us that one of the reasons why the Kings had their hands full with the Sharks in their playoff series back in April, is the simple fact that the Sharks generate a greater percentage of their offense from a Behind the Net attacking approach. Payne highlighted his team’s ability to to move low-to-high or even climb high in the offensive zone (the forward with the puck skates to the top of the zone as the defensemen shift in the other direction, creating new passing lanes). Unfortunately, their offensive gameplan for this series was at a disadvantage before the puck was ever dropped.
Split-Half Reliability and Predictability Test of Offensive Systems
Now, breaking down video is fun, and so is talking tactics and systems, but as we collect more and more data that can inform us of exactly how teams are doing things, we can then analyze it and subject it to testing just as we have done with Corsi and other metrics.
In order to quantify these types of offensive zone decisions, I took the eight teams that we’ve tracked at least thirty games for this past season, giving me a total of @ 340 games (give or take a few due to games played against each other), and performed an even/odd split-half analysis. I eliminated the other teams from this study so to as to minimize variance as the smaller the number of games you’re dealing with, the greater the inherent noise. For those that are unaware, a split-half test uses what happened in one half of the data (even-numbered games) to predict what happened in the other half (odd-numbered games). If there is next to no correlation, then what you’re observing is likely random.
First up, I looked at the even and odd per sixty minute rates for shot assists, behind the net shot assists, low-to-high shot assists, and shots (Corsi). I wanted to see how these metrics and styles of offense would compare to Corsi, since we know that is a reliable metric. All of this data is from 5v5 situations.

What we learn is that how teams pass the puck to generate offense is repeatable, which makes sense given that play in the offensive zone is largely dictated by the coaching staff beforehand.
Next up, we’re going to see how well the rate at which a team scores goals in even games predicts how often they’ll score in odd games.

Not very well, but we know that goal-based analysis is less reliable than a shot-based one. Now we’re going to take a look at how each of the above four metrics in the even sample of games predict goal-scoring in the odd sample of games.
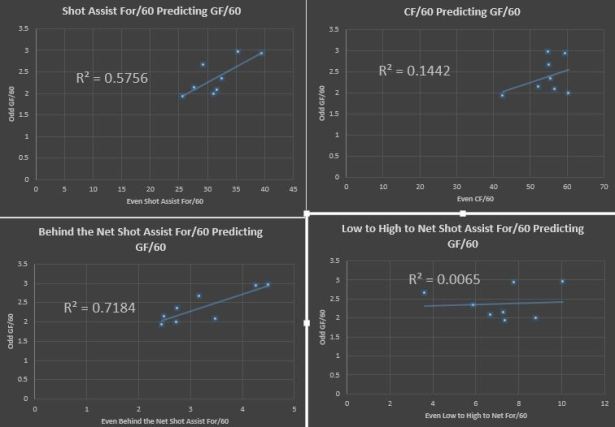
We still see shots (Corsi) outperforming goals and that is the strength of that metric. However, we also see that the rate at which teams assist on shots through their passes holds some strong predictive value at this exploratory stage, which echoes what I found at the player level. This makes sense as our data (close to 1000 games over the last three seasons) continues to demonstrate that you are more likely to score on shot assists that shots in general. Furthermore, it becomes quite apparent that the Behind the Net Attack approach in the offensive zone is worth whatever risk associated with it compared to the safety valve of generating point shots or trying for deflections.
If your plan is to score goals and create rebounds, play behind the net.
Conclusions
There are positives and things to be excited about as we can dig further into passing data. There are also things here that may change as we collect more data and can add more teams into these tests. My hope is we can get at least 40 games done for each team this season as that would give us a sizable data set (only 200 or so games away from it) to run more tests (and also include player analysis). As garik16 highlighted in his piece on entries, some of Eric Tulsky’s original work was correct, but some of his initial findings were not true once we acquired more data from Corey Sznajder.
So, things can change, but I think much of this makes sense and goes to show that teams can quantify offensive styles and adjust their tactics as warranted. This type of tracking can also be applied to discover which types of forechecking systems are most effective, what powerplay formations are most deadly, and what penalty kill formations are the best at suppressing chances. For example, how effective is a Box +1 defensive zone system at limiting scoring chances? A Sagging Zone? What types of breakouts are most vulnerable to a 1-2-2 neutral zone forecheck? A 1-3-1? With so many people interested in tracking data nowadays, I believe something like this is just around the corner and would be of immense value. It’s and advantage that manual tracking offers as an advantage over mountains of data with no contextual description.
A video coach at the NHL level should have the resources (possibly even from their analytics department?) to quantify their team’s tactical decisions if they desire to. Quantifying how teams play and informing the coaching staff of alternate approaches based on their opposition is the logical next step in hockey analytics. That is, what I like to refer to as, simply, Tactalytics (tactics + analytics).

I guess the biggest question is what happened in the last year of DeBoer’s previous pit stops.
I’m assuming teams adapt, force passing lanes to the point.
I guess the easy question to ask is: what happened at DeBoer’s last two stops from start to finish?
God, I hate wordpress
Nice piece.
One thing to keep in mind is that no matter how good a tactic appears to work, if you are a one trick pony, the opposition will find a way to exploit this. Thus, even though creating plays from down low has a far higher payoff percentage, if you never use the shot from the point, you make it easier for the opposition to defend against your attack. Presenting a variety of offensive strategies, prevents the opposition from cheating on defense and creates more time and space due to the uncertainty.
At the risk of oversimplifying the argument, if comparing to boxing, this would be akin to working the body to open up your opponent’s defence so you can land more punches to the head. By themselves, body blows may soften an opponent but won’t win a fight. By the same token, spending 100% of your punches looking for a knockout essentially guarantees that your opponent will have an easy time defending themselves. The combination of the two strategies allows for the potentially more damaging attacks to have more effectiveness.
The next logical progression to answering these questions is how often should a team uses the less lethal options to optimize the effectiveness of their most lethal options?
I recall reading a study on basketball a few years back that examined why incorporating less effective tactics periodically actually increased the effectiveness of the higher percentage plays. I can’t find it to link here, but will post later if I do.
Thanks Doctor Kev,
I made that same point on a recent episode of Japers’ Rink Radio (http://www.japersrink.com/2016/7/22/12256266/jrr-episode-17-low-to-high-and-offensive-efficency) as I think changing up your tactics based on personnel is a good way to keep your opponent off balance. I think teams should use a behind the net attack more often than some do now, but teams should never adopt a tactic as their singular strategy…unless of course it works so well 🙂