
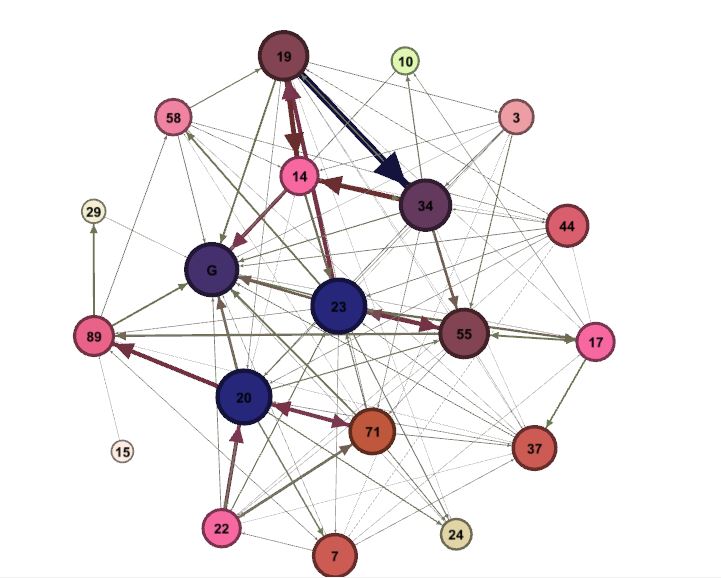
The last two pieces of mine focused on passing network analysis for both the Erie Otters and Oshawa Generals from their 2015 OHL Final. The point of this short series was to look at how and why teams are successful over a playoff series. Generally, five-game samples aren’t large enough to give much credence to, and yet a sound game plan and tactical preparation can influence an upcoming playoff series. With the type of data collected and analyzed through passing networks, it provides a baseline of how influential the Otters and Generals players were in their series. From there, naturally, any good analyst will go to the video to find evidence of how these numbers occurred, to augment their conclusions. These first two series served as a opportunity to present new ways of analysis with our data this season, something that, come playoff time, will be given a test run in terms of series predictions.
This final piece in this series will focus on the production for each player and team in a more traditional sense. What does that mean? Lots of numbers and charts. For starters, Erie generated far more passing offense in this series than Oshawa. At 5v5, here were the Otters possession numbers for shot sequences from single, multiple, and scoring chance passes.
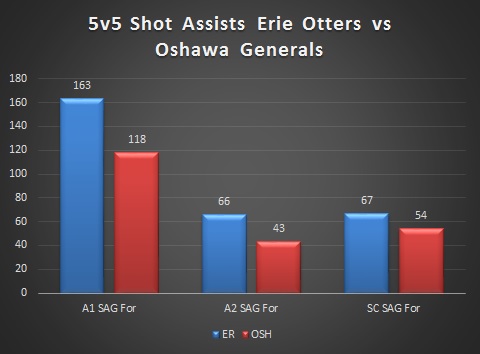
So, Erie not only heavily out shot Oshawa in shot assists, but also held a sizable advantage in sustained passing possession – shot attempts generated on multiple passes. Why does it matter if they come from a single or multiple passes? Based on the 500 games we tracked last season, and now including the 100+ we’ve tracked this year, a noticeable trend emerges based on number of passes and shooting percentage: the more passes that precede the shot, the higher probability of a goal. Couple that face with the fact that shots generated via passing is a repeatable skill for players (will look at team repeatability as we get more data this season) and it’s apparent that sustained possession matters.
Generating scoring chances was also an area Erie held an advantage over Oshawa. As we dig into each team’s rosters, we can guess who was generating most of this offense.
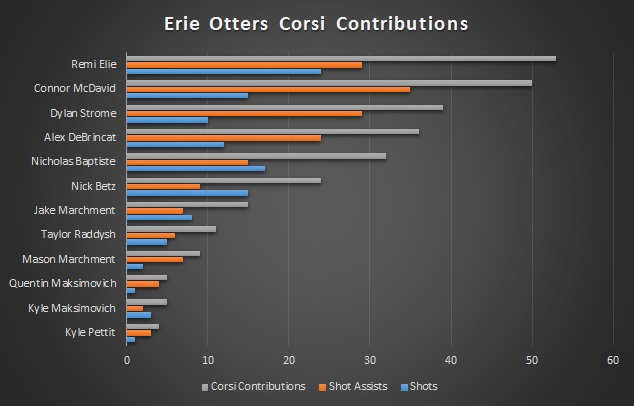
So, as I mentioned in my first post, Remi Elie had a hand in a few more shot attempts than phenom line mate, Connor McDavid. The two of them combined to create so much against Oshawa. There’s a dropoff to Dylan Strome, Alex DeBrincat, and Nicholas Baptiste, and then another to Nick Betz and the rest of the forwards, but while we expected to see McDavid and Strome atop this list, Elie was a surprise (to me, at least). No surprise that McDavid generated the highest number of shot attempts through passes, but Elie’s shot-generation was on par with Strome’s.
Moving to the Erie defensemen.
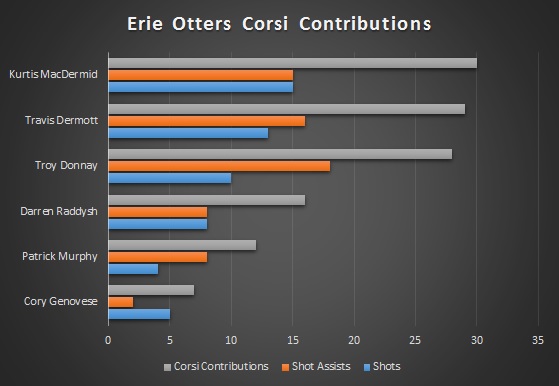
Great balance among the top three of Kurtis MacDermid, Travis Dermott, and Troy Donnay, but a quick and drastic dropoff among their bottom three blue liners. Not only is there balance among the top three in terms of their overall contributions, but their production is balanced between shots and shot assists.
So, let’s see Oshawa’s forward production.
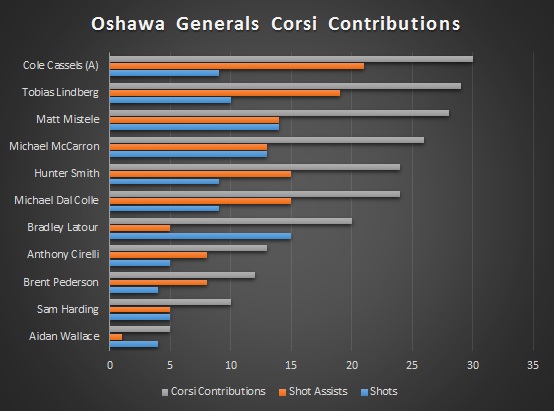
While they don’t have a standout performer or pair of performers like Erie did, options one through six are all relatively close in their offensive contributions. Granted, many of them are far behind the output of the Otters’ top forwards. Let’s move to the blue line.
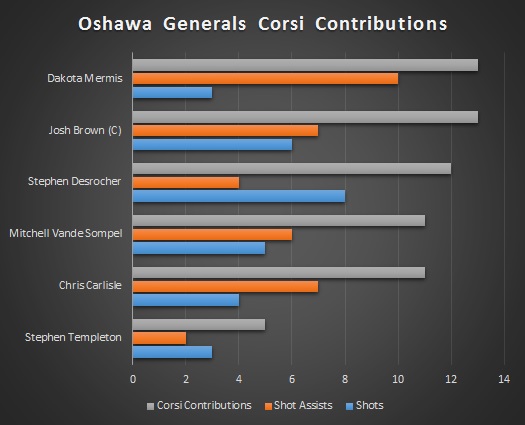
Similar to their forwards, Oshawa’s blue line shows incredible balance, albeit at lower totals than their blue line counterparts on Erie. So, overall, Erie produced at a much higher rate of production, but that’s to be expected given they rarely led in the series.
Moving onto what I simply refer to as Danger Zone Chances (shot sequences in which the final pass preceding the shot attempt is made across the Royal Road or from behind the end line). These are more dangerous than a typical scoring chance as they imply that the goaltender is moving to track the puck and a shot is attempted inside the home plate area. First up are the Erie forwards.
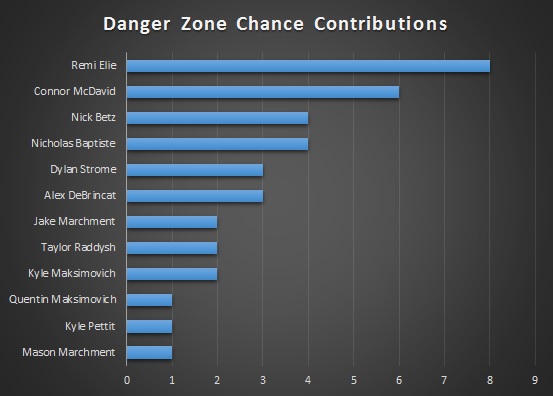
Elie and McDavid lead the way, unsurprisingly. These types of shots would have led to their higher Weighted Degree measures that I went over in the first post on their passing network. Erie scored on two of the eight of these attempts that reached the net. Oshawa scored on three of nine that reached the net. Let’s see how their forwards contributed.
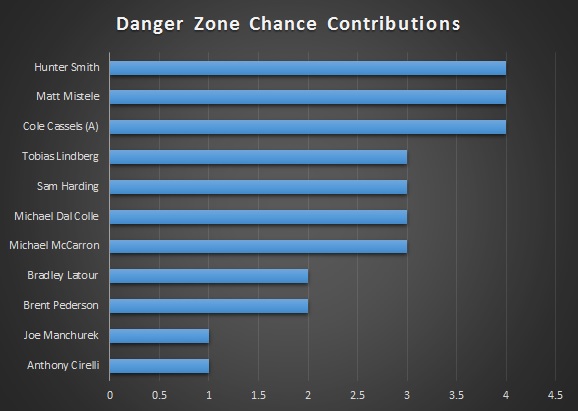
Again, a lower number of overall contributions. In fact, Erie out-chanced Oshawa 21 – 17 in terms of Danger Zone Chances.
Concluding Thoughts
Well, I hope you enjoyed this short series on passing networks and the OHL Final. The whole idea was to introduce newer methods of analysis and how we might use that data, combined with video analysis, to understand more of the how and why things happened the way they did. Furthermore, having this data ahead of time would serve a team well ahead of a matchup during a season, or more importantly, a playoff series. Relying on stats or video alone is foolish: using data and video together is the best solution. Admittedly, this type of analysis will start to take on more meaning when I start to look at our data this season as that will be a larger sample size.
The other reason for doing this was to illustrate, as many others have, just how little we know about the game at the Junior level. As I mentioned in the first post, had passing data been available for Tyler Johnson, it’s certain he would have been drafted with his setup ability available in a quantified fashion. If there are people interested in tracking a few CHL games, by all means let me know.
I’ll be back with a look at the Toronto Maple Leafs data we’ve collected and to answer the Tyler Bozak question once and for all. Maybe.
