
Last time, I took a look at the passing network for the Erie Otters during the 2015 OHL Final. Today, we’ll take a look at the passing network for the Oshawa Generals. Below you’ll see their network constructed using Gephi.
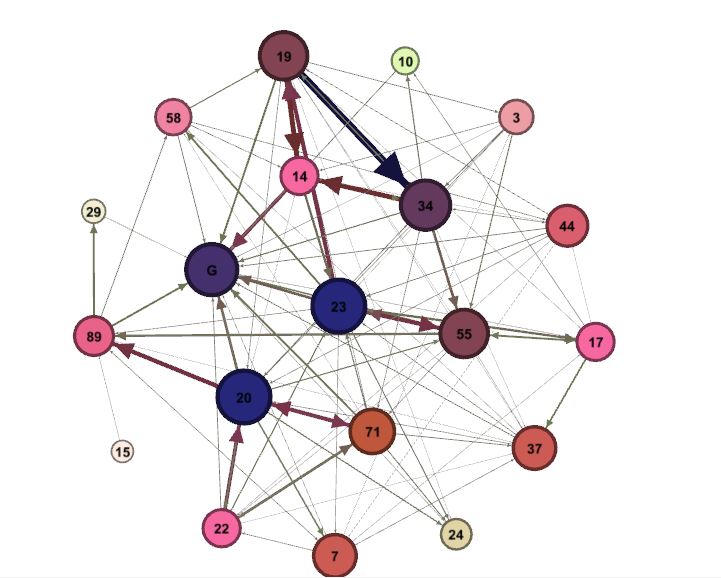
Another reminder on how to read the visual: The larger and darker the node (player), the higher number of edges (connections or passes) to another player or goal (shots) that player had. Rather than simply total up the passes and shots, I’ve assigned weights based on whether that pass led to an actual shot on goal, was a scoring chance, was a danger zone pass (from behind the end line or across the Royal Road), resulted in a goal, etc. The edges (lines) between players are weighted as well, so you can tell which players were setting up a higher number of chances for specific shooters.
The first thing that stands out is how much more balanced the Generals’ attack was compared to the Otters’. Here, you have Matt Mistele and Tobias Lindberg with the highest number of connections to other players, and just beneath them were Cole Cassels, Michael McCarron, and Hunter Smith. When compared alongside the same visual from last week, we can quickly infer the Generals’ attack much more varied and diverse. Whereas Erie was heavily reliant on the likes of Remi Elie, Connor McDavid, and Dylan Strome, Oshawa was successful in generating offense through multiple players.
Let’s look at the Betweeness Centrality measure for Oshawa.
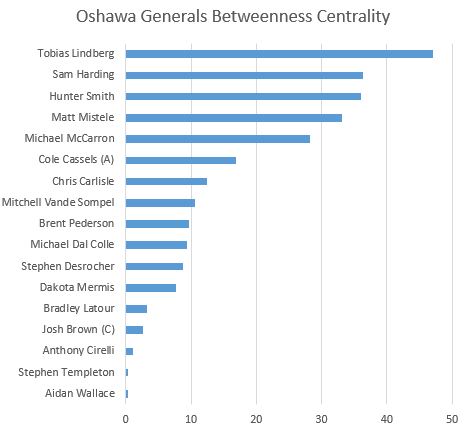
Over a sample size like a five-game playoff series, you’re bound to see a few odd results, such as the presence of Sam Harding, yet an interesting pattern does emerge. Oshawa’s key contributors were all forwards, whereas Erie felt much more impact from their blue line. Naturally, the first question we come up with is how were their forwards much more involved than the defensemen? Part of Oshawa’s success was at home where they were able to match lines as they saw fit. On the road, several of their forwards contributed with as much or consistent levels of success as the home games in the series. Notable performers at home were Hunter Smith (sixteen shot contributions – pass or shot, eight total passes leading to shots), Tobias Lindberg (sixteen shot contributions, ten passes leading to shots), and Cole Cassels (fifteen shot contributions, twelve passes leading to shots). With one fewer game on the road in the series, only Smith saw a significant drop in production. So, while a visit to Erie for games three and four saw an increase in production for McDavid and Elie, Oshawa’s forwards were able to maintain levels of production despite venue and matchups.
Continuing that train of thought, and following up on the Betweeness chart above, using this data and taking a closer look at the video from their matchup, there are a few aspects of Oshawa’s gameplay that explained their forward production and involvement. First up, their forecheck again. I made mention of this last in my last piece, but it bears further evidence.

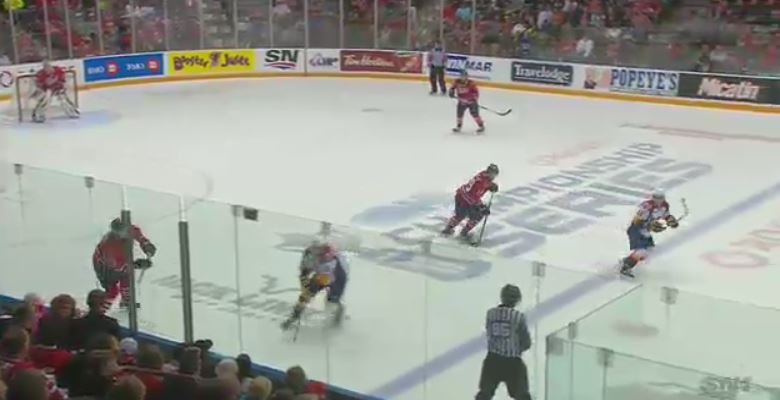
This is a look at the the Generals sending two forwards in deep to pressure the puck carrier.

Aidan Wallace (10 in the picture) moves in to force a pass up the near boards.

Only, the pass doesn’t quite make it there and it results in a turnover, one in which leads to a great scoring chance for Oshawa. Here’s the look at the full loop.

Such chances are created often entirely by the forwards involved. But, not only were their forwards successful in generating offense off of a solid forecheck, but also in transitioning quickly from defense to offense starting at their end of the ice.
The below clips show two similar situations: Erie’s forecheckers caught deep and failing to prevent the Generals from exiting the zone. Each time, Oshawa is able to quickly advance play and generate chances, one of which leads to a goal. The first time it is a defenseman leading the charge, and the second is from a forward defending low against Erie’s forecheck.


The other passing network chart we looked at in my Erie post was on a player’s “Weighted Degree,” which is assigning weights to the type of passes or shot attempts they generated in order to separate scoring chances from shots from the point and such. I like this measure because it accounts for a player’s ability to set up quality chances, as well as accounting for a player’s own ability to get into dangerous locations or create for themselves. Let’s have a look at the same for Oshawa.
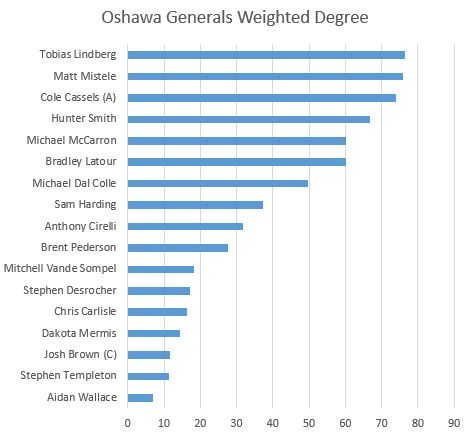
We quickly see, again, that Tobias Lindberg was the main man for Oshawa. Not too far behind is Mistele and Cassels. You instantly see more balance from the Generals rather than the Elie and McDavid-led Otters. Having this type of balance suggests a few things: 1) The overall talent on the Generals exceeded that on the Otters, or 2) The structure in the General’s system allowed for greater opportunity. I’ve already shown the success with which Oshawa forechecked, exited the zone, and, last time, defended against McDavid, now let’s look at another area where they were able to find success through structure.

This is the beginning of a breakaway goal for the Generals. It is a defensive zone faceoff in Oshawa’s zone.

Cole Cassels wins the faceoff and everyone starts to move into position. The winger to the left in your screen (Hunter Smith) will occupy a position along the boards. The winger to the right in your screen (Bradley Latour) will start to stretch the neutral zone and head towards Erie’s blue line.
Oshawa’s Josh Brown receives the puck from Cassels and sends it out of the zone to where Smith is parked on the near boards.

Smith deflects this pass on for Latour to latch onto at the blue line, now that he has gotten behind his marker.

This goal seals the series for Oshawa. A sound, well-executed play for Oshawa, much like they did for this entire series. Set plays work out quite well when players know their responsibilities and can execute them properly.
Concluding Thoughts
The Oshawa Generals appeared to win this series due to the depth at the top of their lineup. They were able to win matchups at home and, due to how well-balanced their lineup was, did not face too much of a dropoff while on the road where McDavid and Elie were able to run riot a bit more.
As I mentioned in my piece on Erie’s network, having this data available offers new ways of preparing for upcoming matchups. While these first two posts have focused on network analysis and video evidence, the third and final post in this series will look deeper in the numbers for each team.
