

Last time, I showed how using data and video evidence can be combined to inform tactical offensive zone decisions. Today, I’m going to do the same thing in the neutral zone. Neutral zone play is something that has been a hot topic among analysts for many years, going back to this paper written by Eric Tulsky, Geoffrey Detweiler, Robert Spencer, and Corey Sznajder. Our own garik16 wrote a great piece covering neutral zone tracking. Jen Lute Costella’s work shows that scoring occurs sooner with a controlled entry than an uncontrolled entry.
However, for all the work that goes into zone entries, there have been few efforts to account for how predictable these metrics are. At the end of the day, what matters is how we can better predict future goal-scoring. Also, in looking at our passing data, what can we also learn about how actions are linked when entering the zone? Does simply getting into the offensive zone matter? Does it matter whether it’s controlled or not? Or, does what happen after you enter the zone matter exponentially more? Lastly, what decisions can we make to improve the team’s process using this data?
Using the data from Corey Sznajder‘s All Three Zones Project (which you purchase here), we now have a full season of entry data to test in this fashion. While a single season isn’t ideal (goes the same for my passing project), it allows us to at least work to establish baselines and conduct exploratory analysis to see where to go with our next efforts. All the entry data in the following charts is from his project. So, we’re going to begin by taking a look at how repeatable and predictive controlled entries, dump-ins, and total entries are at the team level at a per-sixty minute rate and how they compare to total shots (Corsi). We’ll again be using a split-half test to look at data in the even half of games predicting data in the odd half of games. First up, and this is just re-confirming well-tread ground, how repeatable entries are:

I’ve included the p-values on all the charts, but they will not show with reliable relationships due to how small their number is, which is what we want to see. What this chart tells us is that whether a team enters with possession or not, or if you’re just looking at the team’s total number of entries/60, these numbers are repeatable and not due to chance. Next, we’ll see how they do in predicting shots/60. These are a team’s numbers in their even games predicting numbers in their odd games.

Here we start to see some changes. When predicting shot rates, you’ll notice that a team’s shot rate is still the best predictor of its future shot rate. However, I was surprised to see how low the Controlled Entry/60 metric predicted shots/60 in the odd sample of the population. You’ll notice the p-value for Controlled Entries is just inside the accepted 0.05 threshold (if the p-value is below this number, there is a less than five percent chance the results we’re seeing are random), however the same cannot be said for dump-ins.
The small relationship we see in dump-ins predicting shot rates is insignificant and possibly due to randomness. Unsurprisingly, the rate at which teams dump the puck in has little to no effect in predicting future shots. Now let’s look at predicting future goals.

Well, dump-ins are even more unimpressive and unreliable when predicting future goals. Controlled entry rates predict future goals almost as well as shots do, which makes sense considering those are important events, but don’t account for all the ways shots are created. What really stands out is how predictive a team’s total entries are at predicting future goals, significantly better than a team’s shot rates. Again, like total shots, this makes sense if we use shots and entries as proxies for puck possession and offensive attacks.
Quick Summary
- All types of entries are repeatable
- Controlled entries are significantly more predictive than dump-ins
- A team’s total rate of entries appears to predict out-of-sample goals better than shot rates
Digging Deeper
But we’re not done. Not by a long shot. This type of analysis serves as the starting point to further dig into how we can use data to inform a team’s tactical decision-making in the neutral zone. The fact that a team’s rate of total entries outperforms their shot rates tells us we’re missing something in the data. There’s a lot that could or could not happen between when a puck is dumped or carried into the zone. Does the team set up in a passive forecheck or go hard after the puck? Score state may play into this for sure, but without forechecking data to inform us of a team’s success in that phase of the game, it remains a theory. Luckily for us, recent Hockey-Graphs free agent signing Prashanth Iyer is taking it upon himself to track forechecking data that we can analyze. If you want to help him out, hit him up on Twitter.
However, we can quantify decision-making on controlled entries with our passing data. Since we only record passes on sequences that lead to shots, we don’t record every controlled entry. Based off of 5v5 averages on a per-game basis using Corey’s data, however, we can deduce that we account for roughly 42% of all controlled entries with our passing data. So, it’s not a perfect comparison, but enough to formulate informed analysis.
Below is a chart noting the shot on target (shots that are neither misses or blocks) shooting percentage on three different types of entries. The first occurs when the shot assist acts as the entry assist (pass preceding the shot was from the neutral or defensive zones) and a recipient carries the puck in and shoots with no other action. The second is an entry assist followed by a controlled zone entry and then another pass in the offensive zone. The third is the same as the second sequence, but with two passes in the offensive zone before a shot. Please note that these numbers come from our sample of 400 tracked games from the 2015 – 2016 season.
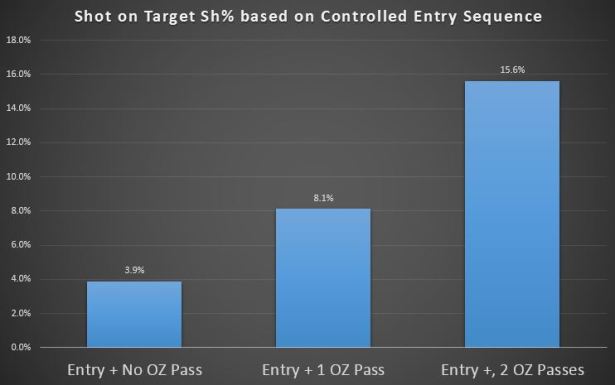
Here we see that simply entering the zone and firing off a shot is unlikely to result in a goal. This is something we all understand quite well: how often have you been watching a game where a player gains the zone only to fire a fifty-foot shot that the goalie easily saves? Now you have a referee-assisted 50/50 puck battle – also known as a faceoff – when you originally had possession inside the zone. Simply entering the zone isn’t enough – we need to go further.
I looked in our passing data and discovered that the Dallas Stars generated the most of these types of plays at a per sixty minute rate (Also, huge thank you and shout out to Krista Asadorian for tracking many of Stars games in our data). Naturally, I went looking for video evidence of their transition game.
Dallas Stars Transition Game
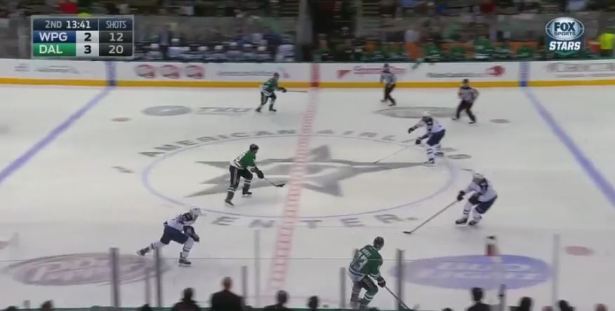
I reviewed our data and then went and tracked the DAL – WPG game from 11/12/2015, studying each neutral zone/transition play of the Stars. Not all of these sequences resulted in shots on goal, but you can see the structure of the Stars’ creativity and aggression at work. There wasn’t so much a predetermined focus on lots of motion regrouping or trickery, but really just speed and support. Let’s get to it.

This is immediately after the Stars get possession in their own zone. Count the players at the blue line. Yes, there are four skaters there. Yes, this is during 5v5 play. The player closest to the Dallas blue line? Jamie Oleksiak. He’s a defensemen. Dallas pushes the pace and doesn’t mess around. Also, notice the score. Dallas has a lead and, while it’s still early in the contest, is still using their speed and aggression to get numbers forward.

Here is another example of Dallas’ D activating in their own zone and allowing an easy transition. John Klingberg reads the play and streaks out of the zone, presenting an easy option for Jamie Benn. Activating your D can often create confusion among the defending team as it’s an extra body they have to account for in transition.

Dallas is also quite good at using the boards in transition. Here, Jordie Benn goes around Nic Ehlers in the neutral zone and Radek Faksa is able to skate in at his leisure and set up Valeri Nichushkin for a one-timer just inside the faceoff circles.
Here’s an example of Dallas skating at the Winnipeg forechecks and simply sending leading passes ahead to their forwards. It’s a tough play to be able to pass ahead of the forecheckers and, at the same time, give your teammate space to make a play in front of the opposing defensemen. Tyler Seguin takes this pass from Alex Goligoski, makes a move around Dustin Byfuglien, and then has a brief two-on-one with Jamie Benn. Benn loses the puck as Dallas loses a chance to generate a shot with Seguin in alone for the rebound.
Dallas doesn’t create a chance here, but the way they attack space, not necessarily a defending player, creates so many opportunities.
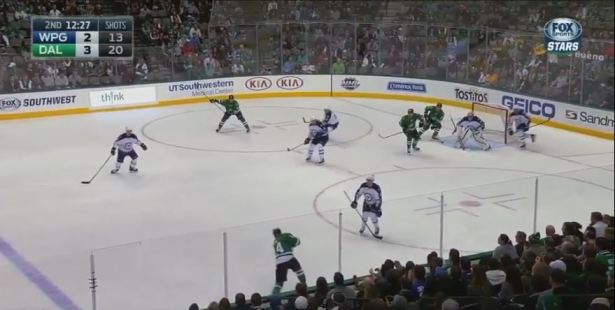
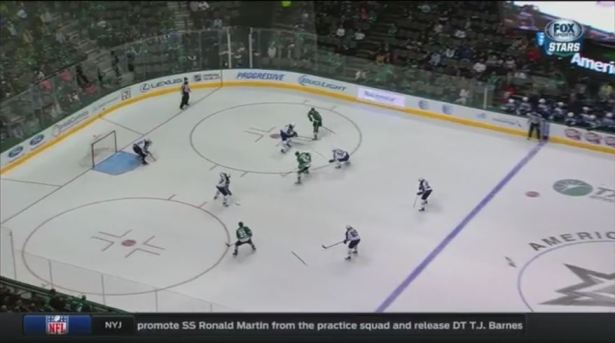
Dallas’ pace in getting into the Winnipeg zone often created problems in the Jets’ defensive zone coverage. This led to dangerous Low-to-High-to-Net plays with the Stars outnumbering the Jets at the goal. While I covered in my last piece that these attacks aren’t always the best course of action, this situation certainly favors the Stars. Dallas has options at the net as well as a clear lane for a cross-ice one-timer option. Getting into the zone with speed and, most importantly, not simply firing off a shot, but giving your team a chance to create a favorable situation is really where you’ll reap the rewards of a good transition game.
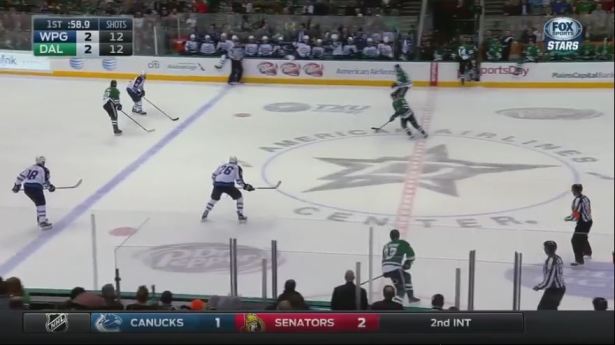
But this is my personal favorite of the Stars’ examples of regrouping pressure. Winnipeg dumps the puck out and Dallas regroups in the neutral zone…with one wrinkle. They regroup on Winnipeg’s side of the red line. This is an up-tempo, aggressive play if I’ve ever seen it. Both teams get a partial change in, but Dallas takes advantage of the open ice that’s available and attacks. Klingberg skates in and draws Blake Wheeler to him.

He dishes the puck to Goligoski, who has plenty of options here. He can drive hard to the net, or he can do what is the better option and draw in the next forechecker while entering the zone.

Unfortunately, Goligoski badly messes up this play. All he has to do is ease the puck ahead into space for Colton Scevior and he’s in 1v1 with the goalie. However, up until this moment, it’s a perfect play in transition: one that attacks the open ice and allows teammates to come in behind for quality chances. It’s what I wrote about here last summer when tracking the Red Army. By attacking the open ice and forcing defenders into making decisions on your terms, scoring chances are just waiting to be created. They create space there by moving the puck here.
Again, it’s a quick attack, but it’s also very well supported. If Sceviour doesn’t read this play developing and attack the space in behind the Winnipeg defender, Goligoski doesn’t have a great option to try and get the puck to him.
Dallas Breakouts
Now, Dallas wasn’t just deadly regrouping in this game – they were able to soundly beat Winnipeg’s, in this game, 2-1-2 forecheck.

Here, they beat it – the best way – by making a pass through the middle and away we go.
One good pass and the Stars forwards are out ahead, pushing Winnipeg back.

Ales Hemsky enters the zone while the Dallas center drives the center lane. Pace creates a favorable situation inside the offensive zone. Hemsky need only slow up a bit and he has a clear lane to pass across for a great chance. Alas, he does not.

You can see Winnipeg set up in a 2-1-2 that is a bit more central here. At the beginning of the clip, the Dallas skaters both swing outside at different depths. Similar to the previous play that Goligoski made to Seguin, Johnny Oduya skates and draws in the forechecker and then sends a pass ahead to lead Faksa. Faksa skates in and then leads to this chance.
Faksa sends it in to Nichushkin, but it bounces over his stick and Winnipeg clears the zone. A little bit of luck and this is a prime chance, created again by Dallas’ pace and aggression in transition.
At this point in the game (3rd period), Winnipeg has had enough and the defense are backed way off. The Jets have three forwards in the offensive zone and their two defensemen at their own blue line. They’ve basically ceded the neutral zone for fear of being blown by again. That’s another advantage of this strategy: force the opponents to try and adjust to you. During the second period of this game, the Stars were even more aggressive with a stretch play that saw them create three oddman situations, including two breakways for Hemsky, one of which he converted. It may have been a tactical decision to exploit the long change, and considering this play happens early in the third period, Winnipeg is clearly affected by it.
Summary of Dallas Transition
- They typically have a forward leave the zone early to offer a stretch option, applying pressure to the opposing defense
- When they did dump the puck in, they often executed a cross-ice dump-in, forcing the defense to shift their coverage, leading to the Dallas forwards having the advantage
- Aggression – attacking space around and behind defenders creates mismatches in transition that lead to offensive zone advantages
- Support – Skaters are always nearby to offer a passing option as they transition, preventing defenders from successfully keying in on the puck-carrier
Split-Half Test of Transition Plays
With our passing data, we can identify sequences of plays on the ice that lead to elevated shooting percentage. At the team level, we can also identify which teams create more of these, in this case, the Dallas Stars. Using the same criteria as my last piece (teams with >30 games tracked, which gave us nine teams) we can run a split-half test to see if this an important style of play.
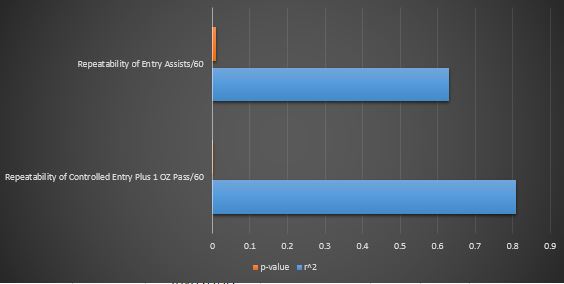
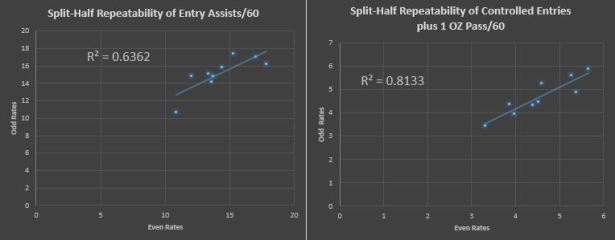
Now, we can easily see that the rate at which teams make passes into the zone on controlled entries, as well as sustained passing sequences in transition, are repeatable and not due to randomness.


The takeaway here in this exploratory analysis is that not only is effective passing in transition repeatable, but it’s also significantly more effective at predicting future goals than shot or entry rates. Notice that within this sample, entering the zone from a pass is slightly more predictive than overall controlled entries based off the baseline established with Corey’s 2013 – 2014 data. However, once again, what happens next inside the zone is of far greater value.
Now, a few words here on p-values. With smaller samples, our findings are prone to more influences of randomness, so rather than conclude CF/60 is a less than stable metric, I offer it up here to only serve as a comparison to some of the passing metrics. Passing plays in transition are significantly better at predicting future goals than shot rates or entry rates that we explored at the outset of this piece. P-values in smaller samples are expected to be noisy, so the fact that our passing metrics fare quite well in comparison is encouraging.
Conclusions
Again, this is another exploratory analysis, and our findings may change as we increase our sample size, but there appears to be more valuable information we can uncover about the game from it. Going back to the premise of this piece – how you enter the zone certainly matters, but the action immediately following your zone entry appears to matter significantly more. How teams enter the zone is the beginning for how they should evaluate their play. It shouldn’t be, “we entered the zone with possession 60% of the time”; it should be, “we were able to transition effectively and convert x number of zone entries into sustained passing sequences to create scoring chances.” That may sound like getting too granular, but my exploratory analysis suggests it’s that level of detail that can open up a game and get your team that winning goal.
Lacking forechecking data, teams should enter the zone with possessoin as much as possible. However, entering the zone with possession and immediately firing off a shot is a terrible idea. You’re looking at a 3.9% conversion rate if your shot reaches the goalie, and then you have to fight for possession all over again in a faceoff. Not only that, but you’ve allowed play to stop and all five defenders to come back into the zone to defend, when your original entry may have given you possibilities in space for a better attack.
The purpose of these tracking projects is to be able to quantify and analyze phases of the game and their impact on shots and goals. NHL video coaches and analysts should be joined at the hip if a team is serious about using data to augment their coaching strategy. When we notice a team, like Dallas, excelling in one area, it forces us to go to the video to try and understand how that is happening: sometimes it’s a predetermined release point or structured set up, and sometimes it’s simply a philosophy. This also offers an opportunity for innovation as it relates to player roles, formations, and roster construction. That’s where this type of work is headed. A coach, hopefully soon, is going to realize you don’t need to fit your players into archaic archetypes of “Forward” and “Defenseman” in order to be successful. Be innovative.

Very interesting work! I think that the name of the game here is getting the puck to high danger areas as quickly and efficiently as possible. Passing is undoubtedly the most efficient way of getting the puck to the net, and being able to pass more frequently, as in the case of a Controlled Entry + 2 passes, makes it much more difficult for the defense and the goalie to get set.
I would be interested to see if teams like Dallas, who seem to be very good at attacking open ice, have higher rates of Controlled Entry + 1 (or 2) OZ passes than other teams. More specifically, I’d like to see those rates as a percentage of total zone entries. Good neutral zone teams would presumably have a higher number of entries leading to shots, but perhaps their ability to create passing options once gaining the zone separates the truly great transition teams from the merely good neutral zone teams.
Thanks for reading, Kevin. Glad you enjoyed it.
I don’t have percentages of entries on hand, but Dallas generated about 6 – 7 of the controlled entry + 1 or 2 OZ Passes per 60 minutes. This was highest among teams we’ve tracked 30 games or more. We’ll see how that stands out as we increase our sample size, but it makes sense given how they play and how much offense they generate.
I think you are correct when you say “perhaps their ability to create passing options once gaining the zone separates the truly great transition teams from the merely good neutral zone teams” and that’s what I tried to illustrate in this piece.
Good way of describing, and good article to get data on the topic of my presentation subject, which i am going to deliver
in academy.