
The All-Star break is now in the past. The trade deadline is less than two weeks away. Teams across the NHL have a pretty good idea of who they are. They know their strengths and weaknesses. The possible outcomes for their seasons are narrowing. Some teams are already locked into playoff spots and only have to worry about positioning. Others will have to slowly accept the reality that this isn’t their year and consider how that impacts their approach at the deadline. This is a perfect time to take a high-level view of the league and look at each team using a series of simple metrics to help get a grasp on where all thirty teams are sitting.
All numbers in the post are via corsica.hockey. Unless otherwise noted, the data is 5v5 only and adjusted for score and venue.
When trying to get a quick look at all thirty teams, shot differential is the most straightforward place to start. Teams that consistently outshoot their opponents generally experience positive results in the long run.
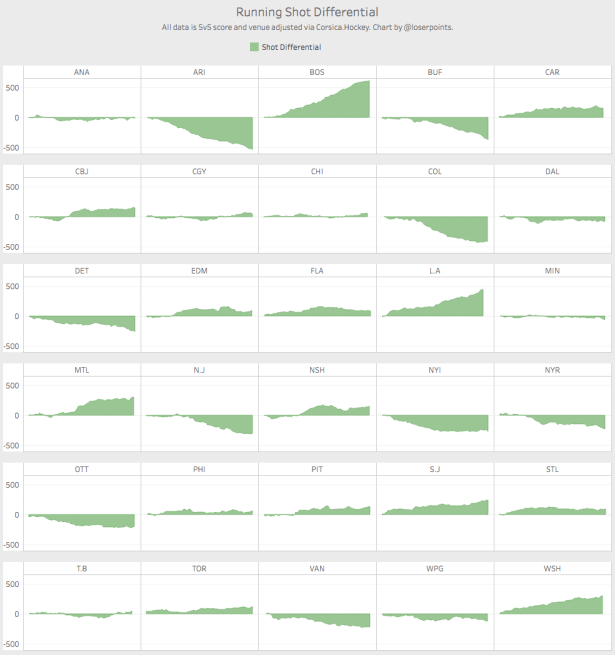
The teams that jump out most given recent events are Boston and Montreal. Firing a coach while the team has the best shot differential in the league is at best, a questionable decision. Based on this set of graphs, Boston appears to be one of the better teams in the league. For more context on Boston’s season, check out last week’s Friday Quick Graphs where Sean Tierney looked deeper into those numbers. The Canadiens also look good in terms of shot differential but they have leveled off over the last month. They’ll turn to Claude Julien in the hopes of getting that differential to start climbing again.
The Kings, Capitals, and Sharks also appear to be consistently outshooting their opponents. Arizona and Colorado are setting a steep pace at the bottom of the league. Interestingly, the Ottawa Senators who are competing for a playoff spot in the Atlantic have one of the worst differentials in the league. If they make the playoffs while getting outshot this significantly, they’ll be everyone’s favorite pick to fall back to reality next season.
Shots are an important part of the story but not the whole story. The next set of graphs looks at expected goals compared to actual goals. In general, goals should align fairly well with expected goals. Big gaps between the two could be an indication of a team experiencing a run of good or bad luck. Small gaps could indicate talent or coaching strengths and weaknesses for that team.
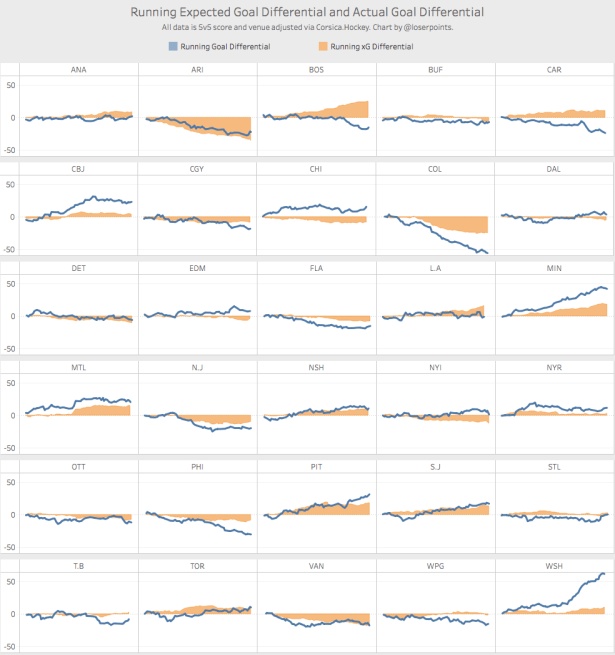
A couple of teams stand out as having major difference between their expected and actual goals. Washington is a good team as evidenced by their shot differential and their positive xG differential. But they aren’t THIS good. Their goal differential is outrageous and suggests that they are getting some help from some hot shooting and goaltending. Columbus and Minnesota are also outperforming their expected numbers. Columbus’ goal differential does appear to be flatlining after climbing steeply during their win streak.
Boston is the team most obviously underperforming their expected goal metrics. Despite strong shot and expected goal numbers, they have a negative goal differential. The Avalanche are also notably underperforming. Much in the same way that Washington is good team getting better results than they deserve, Colorado is a bad team getting worse results than they deserve.
All of the data in the previous two sets of graphs is 5v5 only but power play and penalty kill play are too important to be ignored. The next graphic presents each team’s penalty differential and their goal differential on special teams. These numbers include 5v4 and 4v5 data, which is the bulk of special teams play.
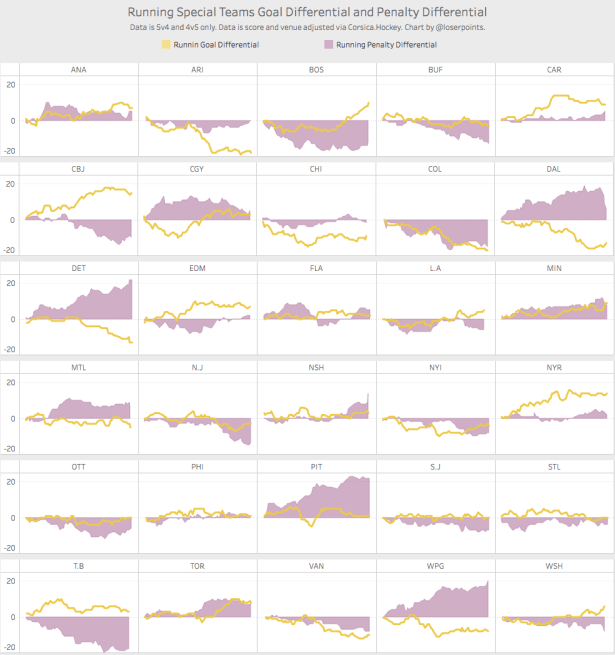
The relatively small sample sizes of time on special teams compared to 5v5 allows for more variance from expectations. Columbus and Tampa are two teams with strong goal differentials compared to their penalty differential. Columbus’ special teams look to be one of the major keys to their success this season. Tampa, while not as strong as Columbus, is somehow managing to maintain a positive goal differential despite taking a ton of penalties.
Detroit, Dallas, Pittsburgh, and Winnipeg all have lower than expected goal differentials based on their penalty differential. All four teams have done well in drawing more penalties than they take but have not experienced positive results. This is likely due to a combination of bad shooting and goaltending luck with some poor play on special teams.
As a final view for this article, the next set of graphs shows each team in comparison to where they were last year in terms of shot differential and expected goal differential. While last year’s performance isn’t important to this season, it does provide context for how teams are trending.
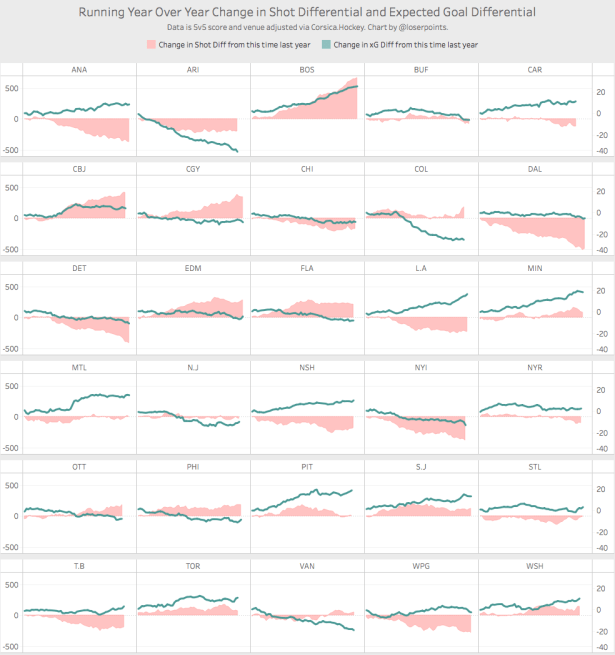
Five teams have made coaching changes in-season. Florida, Boston, Montreal, the Islanders, and St. Louis. Only one of those appears to be obviously worse than they were at this time last year. The Islanders are clearly in worse shape and removing Jack Capuano as head coach makes sense in this context. The other four teams tell a less clear story.
Florida made their change early when they were only showing a small improvement and that decision seemed to be partially driven by a difference of approach between head coach Gerard Gallant and the front office. St. Louis is in largely the same position last year with a slightly worse shot differential and a slightly better expected goal differential. Boston and Montreal are both performing much better by these metrics than they were at this time last year. The firing of Julien remains curious from this view.
Taking a high level view of the league in this way helps identify trends and catch major outliers in performance. This isn’t a report that can be used to draw conclusions about teams but it can help identify areas for further exploration. Taking a step back to put each team’s performance in context is a good way to recalibrate before diving back into the specifics that drive each team’s results.
