
This week, the long-speculated dismissal of Boston Bruins’ coach Claude Julien finally happened. After 759 games, 419 wins, a Stanley Cup, and a Jack Adams trophy over his almost 10-year run in Boston, Julien is a free agent coach, free to mull options like the Vegas Golden Knights, the New York Islanders, and a slew of other head coach positions that are almost certain to be offered to him as the season goes on.
Every coach gets fired sometime. Julien, great as he was, wouldn’t escape this fate either.
But the fallout since his dismissal has been intriguing. The Bruins led the NHL in adjusted Corsi for percentage under Julien this season but sunk to 28th in the in team shooting percentage and 24th in team save percentage this week.
How can we reconcile these contrasting stats?
Some commentators have suggested that the Bruins were “gaming” their Corsi – that is, padding their shot-share rate with low quality shots. Mike Kelly summed up that argument here:
https://twitter.com/MikeKellyNHL/status/829362736685576193
Aside from Kelly’s note about Boston’s results having “nothing to do with them being ‘unlucky,’ what caught my attention was the percentage Kelly quoted – “only 32% of Boston’s shots came from the slot.” Knowing that the Bruins led the NHL in shot-share, one might assume that the team had lots of shot attempts of all types relative to other NHL teams (we’ll show this to be true in a moment). So then, wouldn’t using the percentage of slot shots divided by the team’s total shot attempts misrepresent the actual number or rates of chances that Julien’s Bruins were actually generating?
I decided to make a couple of quick graphs:
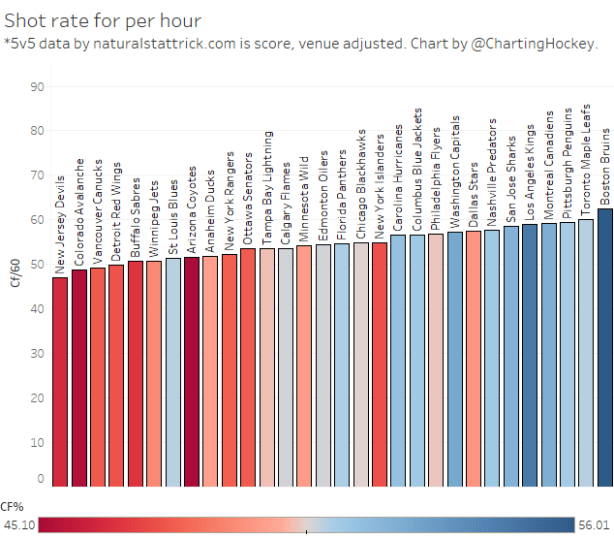
So, no surprise here. Boston leads the NHL in score and venue adjusted CF% and a big part of that is their league-leading rate of shot attempts for. But did Julien have his squad merely lobbing long-distance pucks on goal, padding the overall CF% at the expense of higher-quality attempts?
No. He didn’t.
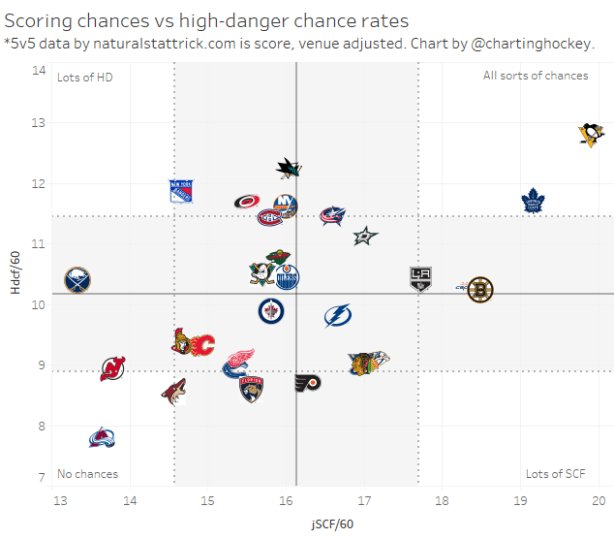
This graph plots each team’s rate of scoring chances against their rate of high-danger chances. To get around the problem of double-counting data, I’ve simply subtracted each team’s high-danger CF rate from their scoring chances for rate (hence, Just Scoring Chances For per 60 or, “jSCF/60” on the x-axis).
Here, we see that the Bruins trailed only the Penguins and Leafs in jSCF/60.
That’s very good.
Not quite as impressively, we find that the Bruins generated a league-average rate of high-danger shots, ranking 16th in the NHL.
Is that good? No.
Is it a bottom-of-the-league result? Also no.
It’s just average.
We can paint a picture of a Bruins team that paced the league in total shot attempts rate, was among the very best at generating scoring chances, and was league-average generating high-danger chances.
Not exactly the profile of a Corsi-gamer.
But we also know that binning shot data isn’t the optimal way to evaluate a team’s generation of offense, as Garret Hohl noted here. Instead, we’re much better off counting all of a team’s shots by using an expected goals model, which weights all shots based on their likelihood of scoring. No data slicing. No bins.
Let’s take a look at Boston’s results in expected goal rates for and against:
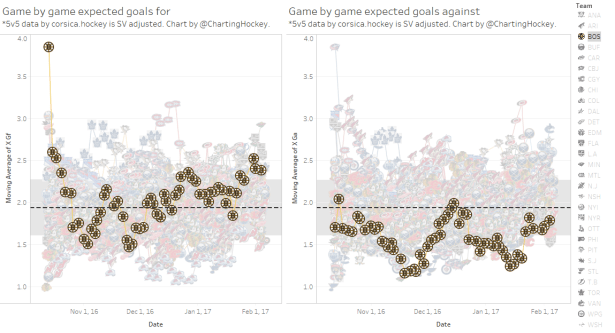
The Bruins’ xGF rate is on the left. We can note that the team had an uneven start to the year but steadily climbed, eventually dragging their xGF five-game rolling average into some elite company at the top of the graph.
And, although we’re not evaluating the team’s save percentage here, we can see on the right of the viz that the Bruins had done excellent work under Julien in limiting expected goals against. They’ve been under the league average reference line virtually all season long.
Let’s recap. Under Julien, the Bruins were…
- league-leaders in rate of shot attempts for (CF60)
- third-best in generating scoring chances (jSCF/60)
- league-average in high-danger chances (HD/60)
- posted excellent expected goal for rates from early December on
- these rates were trending up right up until Julien’s dismissal
Some concluding thoughts
No coach lasts forever. As Elliotte Friedman wrote in “30 Thoughts,” it’s probably best that the uncertainty that has dogged Claude Julien is over. He’ll now have time to step back from the game, field offers from all the teams looking for a coach next season, then plan his own way forward. After a decade in Boston, a fresh start might be nice.
For the Bruins players left behind, there isn’t much room to improve. Their shot rates in all areas are positive. So, unless Bruce Cassidy has a magic wand that can force regression upon the team’s shooting (and save) percentage, it’s hard to imagine this team gets any better.
But who knows. Maybe they’ll get lucky.

One thought I had reading this article is that the discussion of Boston “gaming” its Corsi is an attempt to explain the inconsistency between its top of the leage Corsi for and Corsi differential and its fairly average place in the standings. Stats critics see that disconect as a justification for their dislike of Corsi and other advanced stats, because Corsi indicates that Boston is a league leader, but its standings are average. Advanced stats fans see the Bruin’s bad goaltending and low shooting% and say that Boston has played excellently and is being undermined by bad PDO.
But isn’t your stat showing that the Bruins are leage average in high danger scoring chances really the key here, not only to explaining why Bruins aren’t a premier team in the league standings, but also in explaining why they have such a low PDO? Because shooting% (and thus PDO) and type of scoring chance are not independant variables. I don’t know if there’s a commonly accepted shooting% associated with high/low danger scoring chances, but Corsica seems to identify low danger shots as producing goals on 3% of shots, middling danger shots as producing goals on 9% of shots, and high danger areas as producing goals on 20% of shots. So if the Bruins are taking a league average number of high danger shots, and then top of the league number of low/middle danger shots, aren’t they seriously depressing their shooting percentage?
Claude was the best thing that ever happened to the Bruins.
Need to get rid of that 7′ tall boat anchor