Prospect Cohort Success – Evaluation of Results

2008 NHL Entry Draft Stage.JPG
2008 NHL Entry Draft Stage” by Alexander Laney. Licensed under CC BY-SA 3.0 via Commons.

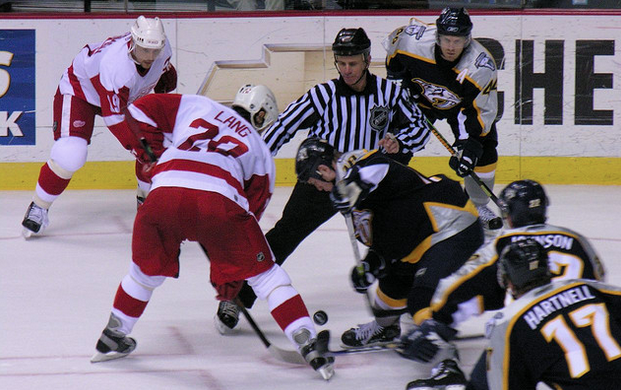
Identifying future NHLers is critical to building a successful NHL team. However, with a global talent pool that spans dozens of leagues worldwide,  drafting is also one of the most challenging aspects of managing an NHL team. In the past, teams have relied heavily on their scouts, hoping to eek out a competitive advantaging by employing those who can see what other scouts miss. Quite a challenge for many scouts that may only be able to watch a prospect a handful of times in a season. While there has been some progress in the past few years with teams incorporating data into their overall decision making, from the outside, the incorporation of data driven decision making in prospect evaluation has been minimal.

To address this, Josh Weissbock and myself have developed a tool for evaluating prospect potential which we call Prospect Cohort Success (PCS), with the help of others in the analytics community including Hockey Graphs Supreme Leader, Garret Hohl.

Continue reading

Hockey Talk: How will the Calgary Flames perform this season

Twenty hockey players in red uniforms stand at centre ice with their sticks raised in salute to the crowd around them.
130223 Calgary Flames salute” by ResoluteOwn work. Licensed under CC BY-SA 3.0 via Commons.

Hockey Talk is a (hopefully) weekly series where you will get to view the dialogue amongst a few of the Hockey-Graphs’ contributors on a particular subject, with some fun tangents.

Prior to the summer moves, we discussed here that the Calgary Flames looked poised to regress, hard. The Flames were one of the most out shot teams to make the playoffs, and the most out shot team ever to make the second round. After making the playoffs with 97 points in a weak pacific, it seemed like they were unlikely to repeat. But, then this summer, the Flames made some interesting moves.

This week we look at whether or not the Calgary Flames will repeat their success or regress out of the playoffs:

Continue reading

Practical Concerns: Why Alfy should do analytics

Yesterday, the Ottawa Senators announced the hiring of Daniel Alfredsson as the team’s Senior Advisor to Hockey Operations. Alumni of the Hockey-Graphs blog Emmanuel Perry (who is a Senators fan) took advantage of the situation to come up with this (obvious hoax): https://twitter.com/MannyElk/status/644648872682242048

alf

Now, the more I think about it, the more I believe that having someone like Daniel Alfredsson lead an NHL analytics group is actually a wonderful idea.

Continue reading

Exceeding Pythagorean Expectations: Part 5

“Bryz-warmup” by Arnold C. Licensed under Public Domain via Commons.

Bryz-warmup” by Arnold C. Licensed under Public Domain via Commons.

This is the fifth part of a five part series. Check out Part 1, Part 2, Part 3, Part 4 here. You can view the series both at Hockey-Graphs.com and APHockey.net.

To quickly recap what I’ve covered in the first four parts of this series, I have updated the work that’s been done on Pythagorean Expectations in hockey, and am looking to find out whether teams that have the best lead-protecting players are able to outperform those expectations consistently.

The first step is to figure out how to assess a player’s ability to protect leads. To do this, for every season, I isolated every player’s Corsi Against/60, Scoring Chances Against/60, Expected Goals Against/60 (courtesy of War-On-Ice) and Goals Against/60 when up a goal at even strength. I then found a team’s lead protecting ability for the year in question by weighting those statistics for each player by the amount of ice time they winded up playing that year. For players that didn’t meet a certain threshold, I gave them what I felt was a decent approximation of replacement level ability. For example, here was the expected lead protecting performance of the 2014-2015 Anaheim Ducks in each of those categories.

Screen Shot 2015-09-12 at 4.04.51 PM

Now let’s look a little closer at our Pythagorean Expectation — derived through PythagenPuck.

Continue reading

Exceeding Pythagorean Expectations: Part 4

“Zdeno Chara 2012” by Sarah Connors. Licenced under Public Domain via Commons.

Zdeno Chara 2012” by Sarah Connors. Licensed under Public Domain via Commons.

This is the fourth part of a five part series. Check out Part 1, Part 2, Part 3, Part 5 here. You can view the series both at Hockey-Graphs.com and APHockey.net.

So now, four parts into this five part series, is probably a good time to discuss my original hypothesis and why I started this study.

As I mentioned in my previous post, baseball has already gone through its Microscope Phase of analytics, where every broadly accepted early claim was put to the test to see whether it held up to strict scrutiny, and whether there were ways of adding nuance and complexity to each theory for more practical purpose. One of the first discoveries of this period was that outperforming one’s Pythagorean expectation for teams could be a sustainable talent — to an extent. Some would still argue that the impact is minimal, but it’s difficult to argue that it’s not there.

What is this sustainable talent? Bullpens. Teams that have the best relievers, particularly closers, are more likely to win close games than those that don’t. One guess that I’ve heard put the impact somewhere around 1 win per season above expectations for teams with elite closers. That’s still not a lot, but it’s significant. My question would be, does such a thing exist in hockey?

Continue reading

Exceeding Pythagorean Expectations: Part 3

“Pythagorus Algebraic Separated” by John Blackburne. Licenced under Public Domain via Commons. The 2006 Red Wings may have been the best hockey team since the lost season.

Pythagorus Algebraic Separated” by John Blackburne. Licenced under Public Domain via Commons. The 2006 Red Wings may have been the best hockey team since the lost season.

This is the third part of a five part series. Check out Part 1, Part 2Part 4, Part 5 here. You can view the series both at Hockey-Graphs.com and APHockey.net.  

Since the last post was getting a little long, I decided to hold off on releasing the full Pythagorean results.

Continue reading

Practical Concerns: Why analytics is politics (and what you should know if an NHL team ever comes calling)

bell

Yesterday, I had a nice chat with a member of the hockey media whom I respect a great deal for his habit of “seeking truth from facts” despite often sitting on panels where his co-hosts did not share the same attitude. He reached out to me with questions regarding something I previously published on Hockey-Graphs, and we spent about 20 minutes exchanging information – something I enjoy doing anytime with people who like to think the game.

At one point, his line of questioning turned to the specifics of the work I was doing, some of which I wasn’t really keen on discussing. So I told him:

“Look, what I do for our staff is pretty simple. I do things either to save time, or to reduce guesswork. That’s all there is to it.”

Continue reading

Exceeding Pythagorean Expectations: Part 2

“Pythagorus Algebraic Separated” by John Blackburne. Licenced under Public Domain via Commons. The 2006 Red Wings may have been the best hockey team since the lost season.

Pythagorus Algebraic Separated” by John Blackburne. Licenced under Public Domain via Commons.

This is the second part of a five part series. Check out Part 1, Part 3, Part 4, Part 5 here. You can view the series both at Hockey-Graphs.com and APHockey.net.

In Part 1, I looked at some of the theory behind Pythagorean Expectations and their origin in baseball. You can find the original formula copied below.

WPct = W/(W+L) = Runs^2/(Runs^2 + Runs Against^2)

The idea behind the formula is that it is a skill to be able to score runs and to be able to prevent them. What isn’t a skill, however — according to the theory — is when one scores or allows those runs. Teams over the course of weeks or months may appear to be able to score runs when they’re most necessary, to squeak out one-run wins, but as much as it looks like a pattern, it is most often simple variance. If you don’t fully buy into that idea, or you don’t really understand what I mean by variance, read this and then come back. Everything should be a lot clearer.

When applying Pythagorean Expectations to hockey, there are a couple of factors that complicate the matter.

Continue reading

Exceeding Pythagorean Expectations: Part 1

Screen Shot 2015-09-13 at 9.13.44 PM

Nashville Predators vs Detroit Red Wings, 18. April 2006” by Sean Russell. Licensed under Public Domain via Commons. The 2006 Red Wings may have been the best hockey team since the lost season.

This is the first part of a five part series. Check out Part 2, Part 3, Part 4, Part 5 here. You can view the series both at Hockey-Graphs.com and APHockey.net.

The 2015-2016 NHL season is almost here, and our sport has come upon a new phase — arguably the third — in its analytics progression.

Continue reading