
In part 1, I laid out the basis for Weighted Points Above Average (wPAA). Now it’s time to change the baseline from average to replacement level. A lot has been written about replacement level, but I’ll try to summarize: replacement level is the performance we would expect to see from a player a team could easily sign or call up to “replace” or fill a vacancy. In theory it is the lowest tier NHL player.
Baseball’s replacement level for WAR is based on the performance of a hypothetical team made up entirely of “replacement players”. The common estimate is that a “replacement team” would end any given season with around a 48-114 record, or a 29.7% winning percentage (you can read more about this here). Since baseball WAR uses the “Pythagenpat” method – or other similar “scores” to wins calculations such as the one employed in Sprigings’ model (here) – adjusting to “above replacement level” is accomplished by adding in the runs equivalent of a ~.200 win % (.500 win % – .297 win %) to every player’s final above average total. Here is the fWAR formula from FanGraphs to give you an idea:
WAR = (Batting Runs + Base Running Runs + Fielding Runs + Positional Adjustment + League Adjustment + Replacement Runs) / (Runs Per Win)
Since I scaled everything to look like points (as noted in Part 1, I was not able to “appropriately” account for skater defense), I will need to calculate replacement level another way. Keith Woolner appears to have made one of the earliest attempts at setting replacement level in the MLB with his Marginal Lineup Value metric. He determined replacement level by:
“…measur[ing] the performance of the league with all of the regular players (starters) removed, essentially measuring the aggregate performance of backups, injury replacements, undeveloped talent, and journeymen players.”
This was the foundation for replacement level in Woolner’s Value Over Replacement Player (VORP) statistic, which measures a player’s offensive value. Woolen and other baseball statisticians implemented this by measuring the performance of all players who were not opening day starters for each team (over a given period of time). Woolner found that replacement players perform at about 80% of league average (referenced here). Unfortunately, the “raw totals” of this metric include differentials (negative numbers) so using a “percent of average” is not feasible.
I next looked at how basketball’s version of VORP determined replacement level. Basketball Reference’s “About Box Plus-Minus” article links to a fantastic post and discussion on Tom Tango’s blog (here) where Tango and friends measured replacement players in a similar fashion. Using Box Plus-Minus, they measured the performance of the top 9 players from each NBA team from the start of each season (they also checked this against players signed to “replacement contracts”). After 130 or so comments they came to the conclusion that the average performance of a replacement level player in the NBA is about -2.0 Box Plus-Minus (where average is 0.0). This method appears to be the most applicable for weighted points. Box Plus-Minus is a regression model that measures performance per 100 possessions above/below average. BPM is converted to VORP using the following calculation:
[BPM – (-2.0)] * (% of minutes played) * (team games/82)
It looks like the “set number” replacement level approach (finding the wPAA per 60 of a group of replacement players) will work best. But how does one define a “replacement player”? Well, using the “non-starters” method (measuring performance of all players who were not opening day starters) appears to be the best method for basketball and baseball. However, hockey does not have a “bench” like the MLB or NBA, so I’m not certain measuring the performance of all scratched players (on opening day) and call-ups is a suitable method for hockey. With that said, I used the “league minimum” salary method, which involves measuring the performance of all players who were paid league minimum (“replacement contracts”).
Calculation
To define a replacement player from a salary perspective, I used the Group 6 UFA age cutoff as a guide and measured all players who signed for league minimum at the age of 25 or older (this should exclude almost all RFA signings as well). Players rarely sign for exactly league minimum, but using this method doesn’t require any type of binning on my part, so I started there. I am unfortunately unable to include “undeveloped talent” using this method. I will hopefully be able to account for this in the future.
Furthermore, if a player signed before April 15th (April 30th in ’12-13) I included the data from that season (i.e. if a player signed on 10/1/15 or 3/1/16 I included data from the 2015-2016 season). Additionally, I only measured the first season after the signing. Almost all of the contracts were 1-year terms, so I feel measuring the first year of the contract is sufficient in this case. Here is what the league minimum contracts look like per year (contract data from CapFriendly.com):
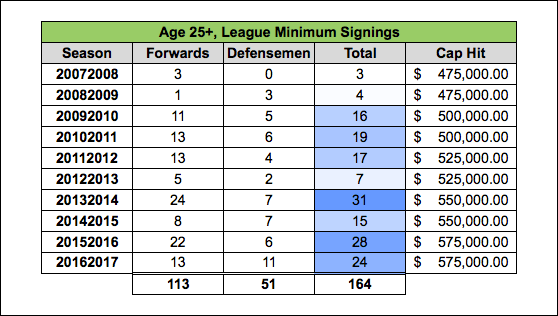
As you can see, there are not a lot of players who play in the NHL on a league minimum contract. Because of this, I also looked at signings that were slightly higher than league minimum. Since the league minimum increases every couple years, I binned contracts/players into percentage-of-league-minimum groups. I used 100%, 110%, 120% and 130% because it looks nice (the ’16-17 equivalent salary for these percentages is $575,000, $632,500, $690,000, and $747,500 respectively). I then totaled the respective Total TOI and Total wPAA figures for all players and calculated the wPAA per 60 for each position for each bin:
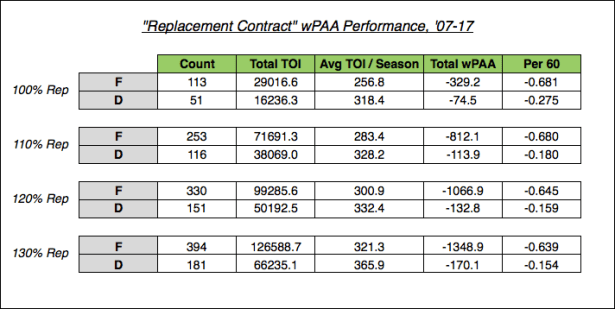
Unsurprisingly, the performance of league minimum players is pretty bad – we can see an increase in performance as the salary increases. This is partially the result of binning with a sample this small – multiple “outliers” shift from one bin to another if the bins are changed (Kurtis Foster’s ’09-10 season comes to mind… seriously, what was that about!?). Another issue here is usage/playing time when using rate stats (i.e. less ice time potentially does not allow true performance level to stabilize). Regardless, a ~.13 spread in wPAA/60 among these contracts is actually pretty small (the spread of wPAA/60 among qualified players is about -1.5 to 3.0 when extremes are excluded).
Because of the issues with binning, I decided to stick with league minimum as my “replacement player” group. This doesn’t require me to make any arbitrary binning decisions and these players happen to be the worst, which is ideal in this situation. I will be using -.681 wPAA/60 for forwards and -.275 wPAA/60 for defensemen as replacement level in this metric. We can now add in “replacement points” to each player’s wPAA to arrive at Weighted Points Above Replacement (wPAR). Here is the final calculation:
wPAR = Counts AA + Diff AA + Pen Taken AA + Pen Drawn AA + Faceoffs AA + (Replacement Rate * Total TOI)
To demonstrate what this looks like, I’ll stick with McDavid’s ’16-17 season from part 1. You simply take his 48.3 wPAA and add in (.681 / 60) * 1718.65 (or 19.5) to arrive at 67.8 wPAR.
Replacement level for qualified players (estimated top 13 forwards and 7 defensemen for each team) is ~22nd percentile for forwards and ~32nd percentile for defensemen. For all qualified players, replacement level is around 26th percentile. This is slightly higher than Sprigings’ model, which had replacement level at ~23% for all qualified players (~25% for forwards and 21% for defensemen). Sprigings did not perform a replacement level measurement relative to average (he assumed baseball’s win % calculation was about right for hockey), so I found the performance of “replacement” defensemen very interesting. But, after all, there are almost twice as many forwards as defensemen so it would make sense that replacement level for defensemen would be higher than forwards.
When I am able, I will test the “non-starters” method for measuring replacement level, but the following remains clear: if a player cannot beat the wPAA/60 performance of the average league minimum cap hit player who is 25 years old or older, I feel it is fair to consider him replaceable (viewed through the lens of this metric).
Additional Replacement Level Information
You might wonder why I’m not adjusting each component separately from above average to above replacement. This has to do with the theory of replacement level. Tom Tango explains this quite succinctly in the basketball replacement level discussion that I linked earlier (comment #131):
“…there are only replacement level PLAYERS. There is no such thing as ‘replacement level’ offense.'”
continued (comment #134):
“…if you characterize it as ‘offense above the replacement level player”, that’s different than saying ‘offense above replacement level offense’. Because there is NO SUCH THING as replacement level offense, but you do have offense contributed by replacement level players. It’s not a nuance, it’s not a distinction without a difference. It’s a clear line that talks about players as players.”
Tango goes on to suggest that basketball VORP be made up of three components: Offense Above Average, Defense Above Average, and Average Above Replacement. I originally measured replacement level for all five components of weighted points and was surprised to find that these players were actually pretty good at everything except for the Counts component (goals, assists, iCF/Tango and ixG) in which they were terrible. Additionally, they were slightly better than average at drawing penalties and only slightly below average at taking penalties and faceoffs. But as Tango explained, compartmentalizing the aspects of a replacement player’s performance is fundamentally flawed – there is no such thing as “replacement level offense” because a player cannot only provide offense (or defense for that matter). Some may find this tedious, but I agree with Tango’s argument and I adapted my model to be in line.
Charts
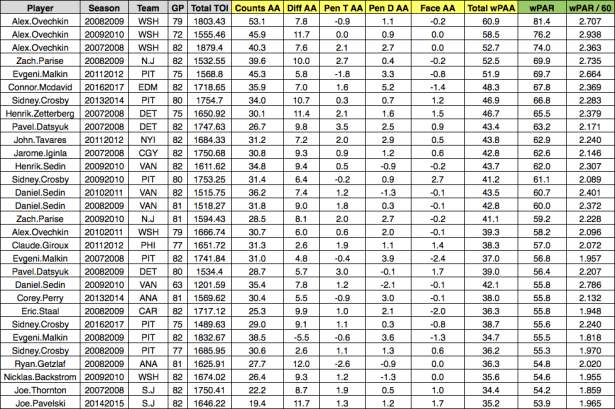
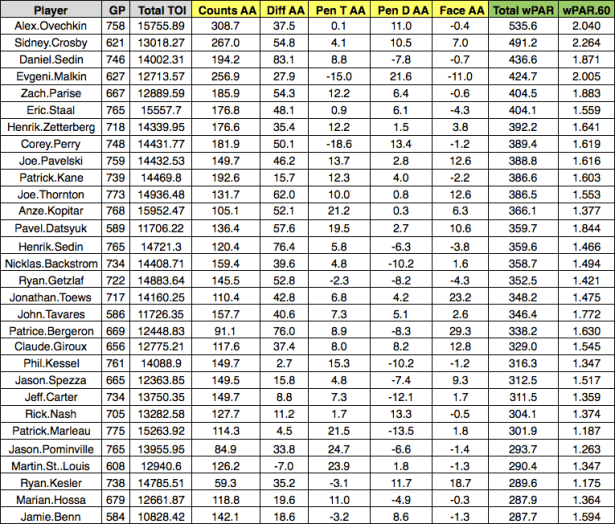
Now that everything’s finished, let’s look at some of the best wPAR player seasons.
Forwards:
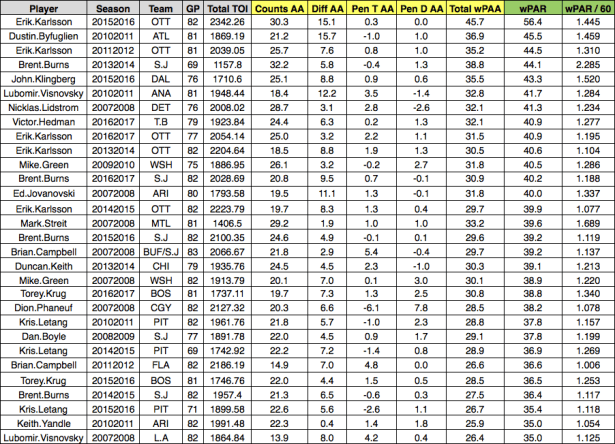
Defensemen:
And here are the “top 30 career” totals for each position (’07-17):
Forwards:
Defensemen:
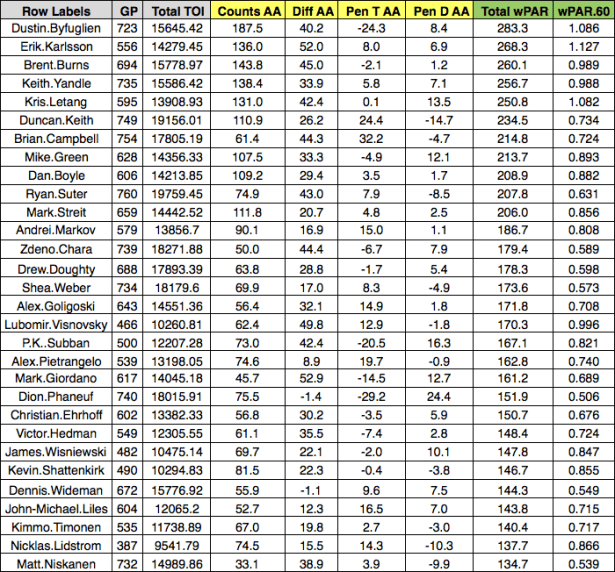
I want to note that wPAR is a counting stat. Players who play a great deal of minutes at a slightly above average rate will have higher season totals than players who play less minutes at a higher rate (depending on the exact situation obviously). This can be seen in the difference between Chara and Doughty’s total wPAR and respective wPAR/60 figures.
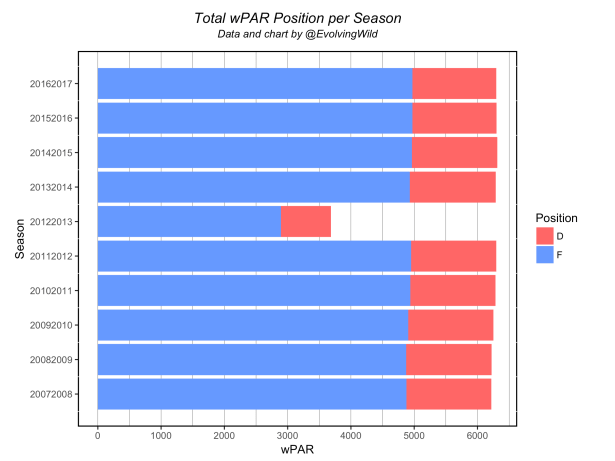
For reference, here are the wPAR season totals broken out by position:
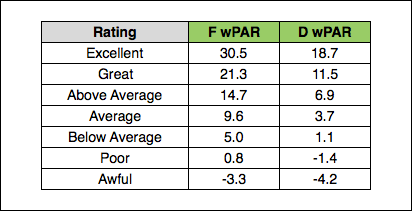
And here is a FanGraphs-style “rating” guide for wPAR (qualified totals where average is 50th percentile and bins are separated by 12.5%):
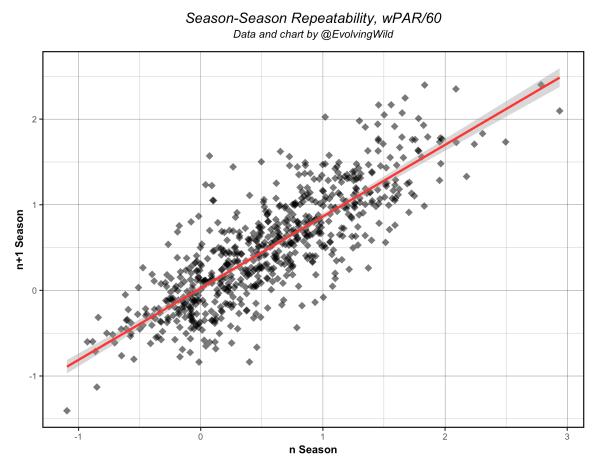
Repeatability
To conduct a repeatability test, I measured the n+3 ~ n+2 seasons for all players who had at least 4 consecutive qualified seasons where n was a player’s first season in the data – this was my attempt to exclude the beginning or end of careers. This resulted in 675 total players. Using this data set, wPAR/60 had an R^2 of .669. If broken out, the forwards and defensemen had R^2 values of .638 and .645 respectively. For context, I also measured the repeatability of a few other metrics using this same group (all stats per 60): Game Score had a R^2 of .635, PAA .531, all situations Points .687, and Points Shares .423. I also tested GAR/60 using the same method (537 players) and came up with a R^2 of .466 (Pure Offense GAR/60 is .638) – I should note that Sprigings’ GAR is kind of weird when used in a standard rate version as I wrote about (here), so take those figures with a grain of salt. There are many ways to test season-to-season repeatability – this was my method. Here is the chart for wPAR/60:
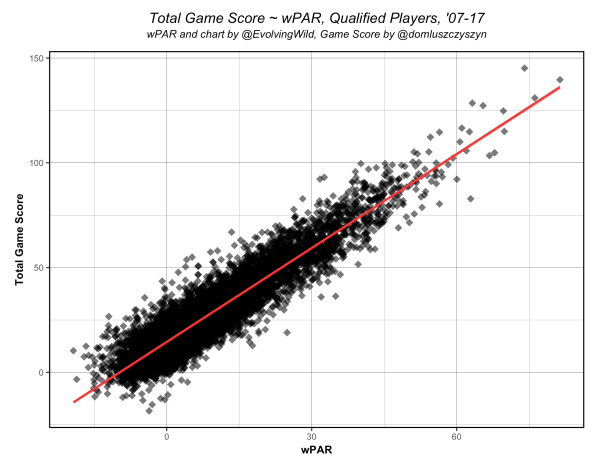
Additionally, I looked at how wPAR correlated with Game Score, Sprigings’ GAR, and “Pure Offense” GAR. This is mostly just to compare wPAR with several publicly available aggregate stats.
Game Score (R^2 = .858):
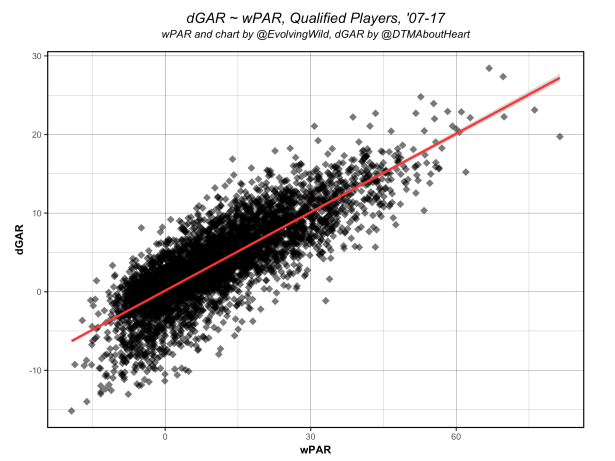
Sprigings’ Overall GAR (R^2 = .679):
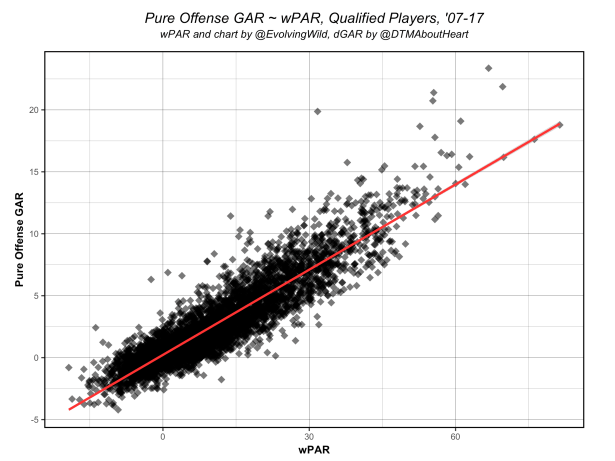
Pure Offense GAR (R^2 = .832):
And for fun, of course, here’s a basic age curve (no survivor bias correction):

Conclusion
So, there you have it. I should note that there are future metrics that could be added to this model when made available. Ryan Stimson’s passing project work (more specifically shot assists) and Corey Sznajder’s zone entry work could be incorporated when all the data is captured for every player. This could better account for playmaking abilities beyond assists and provide more suitable options for measuring skater defense – I’m extremely excited about their work.
My initial goal with this project was to create a relatively simple replacement level aggregate statistic using well-known metrics – not unlike wOBA or wRAA in baseball. As I noted in Part 1, skater defense is incredibly difficult to measure using linear regression techniques and well-known metrics. While an aspect of skater defense is captured I was not able to measure everything. I won’t say that defense is completely absent, but as of right now the final number is rather offense-intensive – I feel viewing this metric as a “weighted point” total above replacement is appropriate. I hope this might provide a more comprehensive player “point total” and allow fans to see the benefits of replacement level as a baseline for player evaluation in hockey.
Data
All wPAR data from the past 10 seasons can be found here. Additionally, Muneeb told all of us that we should release our R scripts, so I’ve made it available here. I’m sure there are ways my code could be improved, but it works.
Acknowledgements
I would like to thank the following people for the help they provided with constructing this model:
- Manny Perry for his NHL play-by-play scraper, xG model, and for the help he provided with troubleshooting issues with the NHL’s play by play data – I could not have done any of this without Manny’s help
- Dom Luszczyszyn for his feedback on the model and for helping me realize my initial attempt at constructing this was fundamentally flawed
- Dawson Sprigings for his WAR model (the inspiration for this model) and the help he provided in development
- Alex Gable and Matt Pfeffer for their feedback
- Tom Tango for wOBA and his work on replacement level in baseball and basketball
- FanGraphs for their excellent glossary and the green & gray color scheme that I seem to have borrowed without realizing
