
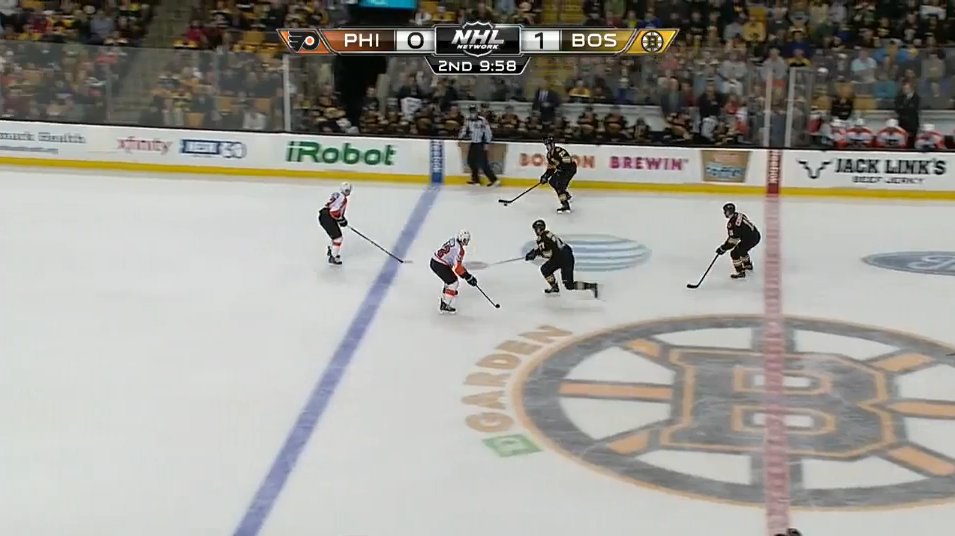
This is the type of entry most likely to be made by a leading team – an odd man rush Carry-In against a d-man conceding the zone (the legendary Andrew MacDonald). Image courtesy of http://www.BroadStreetHockey.com
We know a decent amount about score effects in the game of hockey at this point. We know the obvious: teams play “conservatively” and shell up when leading and become more aggressive when trailing, resulting in the leading team taking less shots and the trailing team taking more.
Less obviously (at first glance anyhow), We also know that the leading team’s shooting % increases substantially when compared to when that same team is tied (Graph courtesy of new Hockey-Graphs writer Petbugs), while the trailing team’s shooting % either increases barely or stays the same as it does when tied.
As detailed earlier on this site this results in the trailing teams tending to score more than leading teams, especially in late.
But what we haven’t really detailed is some of the mechanics of “How” this happens. Some have suggested its because teams may change their systems with a lead or deficit. Others, such as Justin Bourne , have suggested the effect is mainly the result of psychological effects – no one wants to take the risky play when leading and possibly cause the opponent to get the tieing goal as a result of a risk, so players stop taking as many risks when leading even though the coach is preaching the same scheme. But little attention has been paid to seeing if any of these things are true, whether via a statistical analysis or via some systems breakdown.
So what I’m going to do in this post is attempt to break down how score effects change how the neutral zone is played. And by doing so, we can by extension, try to get a better picture of how the play in the other two zone is affected by score effects.
Neutral Zone Score Effects:
In what should be an unsurprising twist given what we know about score effects, teams that are up tend to lose the neutral zone while teams that are down tend to “win” it. The below graph shows the Neutral Zone Score (also known as neutral zone fenwick) of teams in various score situations:
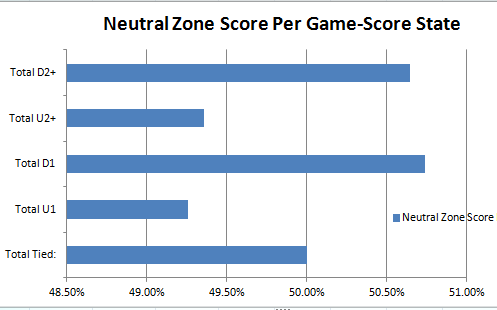
Neutral Zone Score uses the average fenwick results of each type of entry to basically estimate the fenwick % of each team based solely upon their neutral zone entries. As you can see from the above graph, we’d expect teams that are leading (in both up 1 and up 2+) to have fenwick %s around 49.3% based upon their neutral zone play alone (and 50.7% for teams trailing in those situations). This fits with our general score effect possession results.
But how do teams lose the neutral zone when leading? One suggestion you might think is that teams when leading are more dump-happy when leading. After all, carry-ins are seen as a more risky form of entry, even if our neutral zone work has revealed their reward is so so much greater than that of dumps (and thus the risk is very likely overstated). What you may be surprised to find out is that what acually happens is the REVERSE:
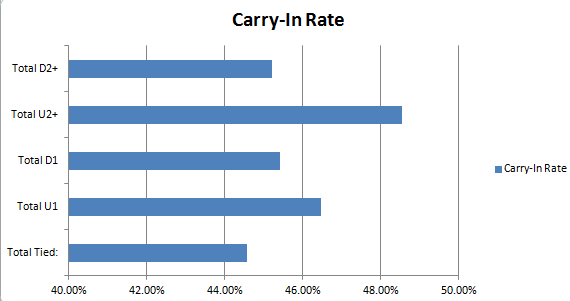
The above graph shows that teams carry in with the puck on a greater percentage of entries when LEADING than when trailing. Basically when teams start to lead, their rate of DUMPING IN goes down, not their rate of carrying in. This is not the risk averse activity we would expect.
What explains this? Well one obvious theory is that our data excludes dump and changes, and teams may be doing so at a higher rate when up (and less so when down), so as to avoid getting caught out there on a long shift with a lead. So perhaps our data is skewed a little by excluding those plays.
Another theory is that teams with the lead may be more focused upon getting the puck out of their own zone by any means necessary, resulting in a greater number of uncontrolled exits.* These exits are more likely to result in the other team getting control of the puck in the neutral zone, and may result in more entries against, which hurt neutral zone performance even if they are dump-ins.
*In theory we can look at this with Corey’s data, but not as its currently available and it would take a LOT of work. It’s the next step of research though.
A third theory may be that teams with the lead only are looking to make a neutral zone entry if it’s clearly available, and would rather not concede the puck if possible. Thus a team leading is more likely to carry in since they’re more picky as to entries in general, while the team leading wants to get in the offensive zone by any means necessary, even if that involves dumping the puck in.
The evidence seems to support these last two theories, particularly the third, as the following graphs show:
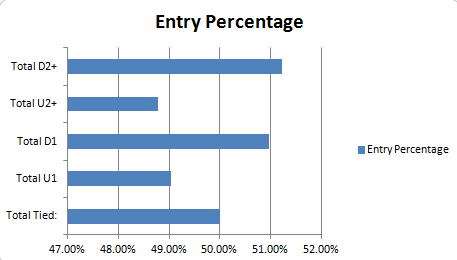
The top graph above shows the entry % of teams at each score state – the percentage of neutral zone entries made by each team (above 50% means you’re making more entries). As you can see, entry percent falls quite a bit when teams are leading.
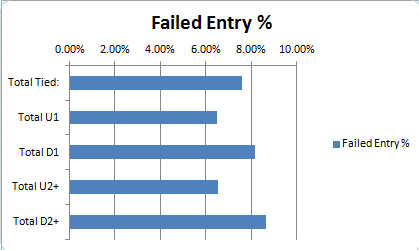
The bottom graph shows the percentage of entries that “fail” at each score state. Failed entries are attempts at entries that are immediate failures – a carry-in or dump-in attempt that fails to get the puck meaningfully into the offensive zone. As tracked by Corey, these include failed dumps (think a dump in attempt that goes straight to a defender such that no forward even tries to chase for the puck.). The failed entry definition is a bit subjective so take it with a grain of salt, but you can see that teams fail on a greater percentage of entries when down and at a lesser rate when leading.
Again, both of these statistics suggest at least partly that our third theory is correct – teams become more picky as to entries when up, while teams who are down will do anything to get the puck into the offensive zone, even if that entails dumping the puck in or taking low percentage entry-attempts that are likely to be broken up.
Given these results, you might wonder how effective dump-ins and carry-ins are at each score situation.

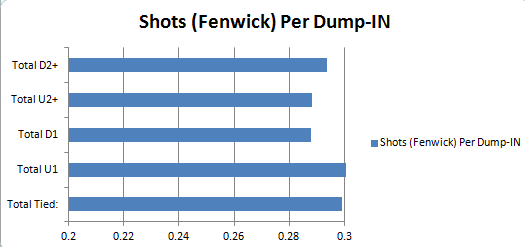
As the above graphs show, there basically isn’t a change in how effective dumps are in any score situations (yeah technically the shots per dump at up 1 is higher than down 1 by a bit, but the size of the effect is small and the pattern at other scores doesn’t suggest that’s particularly real). With carry-ins however, we see the rate of shots off them increases dramatically while teams are leading and falls quite a bit when teams are trailing. Again, this lends credence to our theory of entries above – when teams are leading, they’re more picky as to when they should enter, and thus a higher percentage of their carry-ins are likely plays where the attacking forward has space and thus can get a shot off, while the trailing team is more likely to force it even when the chance of getting a shot off is lower. The effect is negated for dumps because of how random dump-ins are, so there really isn’t much control there.
The end result of all of this is that offensive zone and defensive zone scores (which measure ability to win the shot battle in those zones, and not the neutral zone) increase when a team is leading. Overall score effects are driven largely by the neutral zone performance. This isn’t to say leading teams clearly win those zones outright – again, zone exits likely contribute to neutral zone performance and may be part of the reason why neutral zone score effects look like so.
Conclusion:
In short, Neutral Zone Score effects reveal the following:
1. When teams are up, they become more picky trying to enter the offensive zone. The end result is they make less entries than otherwise, but a greater percentage of their entries are via dangerous carry-in.
2. When teams are down, they become much less picky about entries and try to get the puck in the offensive zone at any cost. As a result, they dump-in at a greater rate and take riskier entries, resulting in failed entries at a greater percentage of the time.
3. Carry-ins become more dangerous for leading teams and less so for trailing teams, likely due to the attitudes shown above.
Most of this isn’t surprising, but again, it’s good to get a better picture into the mechanics behind why score effects take place. The next step in the research is to look into zone exits (and zone exits allowed by the offense) during various score situations. One would expect to see more uncontrolled zone exits while a team is leading….but as we see with neutral zone score effects, some of these results may be surprising.
