
 Can a team lose the neutral zone and still drive possession in the other zones to win the possession battle? Todd McLellan thinks so.
These days, when we talk about possession, we’re typically talking about a player’s corsi/fenwick/shot numbers overall, or we break them down into shots for and against. The thing about doing this is that while it gives you a decent picture of what overall is happening while a player or team is on the ice, it doesn’t really give you a specific picture – does a player have a good corsi because he’s an elite offensive zone player or is it his performance in neutral and defensive zone causing this? Even separating into shots for and against doesn’t narrow this down – for instance, a player can suppress shots by being in the neutral (or hell, even offensive zones), which doesn’t say anything about him necessarily in the defensive zone.
A few years back, Eric Tulsky (and Geoff Detweiler) came up with a way to remedy this: Neutral Zone Tracking.* By tracking the events of the neutral zone, Eric was able to come up with three measures of performance in open play, one for each zone. “Open Play”, by the way, simply means play not off of a faceoff. The three measures are as follows:
*For an introduction to neutral zone tracking, see this article: http://nhlnumbers.com/2012/7/9/how-important-is-neutral-zone-play.
Neutral Zone Score (previously called “Neutral Zone Fenwick” on this site): An estimate of what we’d expect a player’s fenwick to be based upon the neutral zone results while that player is on the ice. We use the average results for carry-ins and dumps to calculate this.
Offensive Zone Score*: An estimate of what we’d expect a player’s fenwick to be based upon his team’s unblocked shot attempts for each type of entry (Carry or Dump) while that player/team was on the ice if the team’s neutral and defensive zone performance was exactly even with the opponent’s.
Defensive Zone Score*: An estimate of what we’d expect a player’s fenwick to be based upon the opponent’s unblocked shot attempts for each type of entry (Carry or Dump) while that player/team was on the ice if the team’s neutral and offensive zone performance was exactly even with the opponent’s.
*In a prior post on this site, I used two basically identical metrics, OZ100 and DZ100, in place of these scores. The two are the same except one is on a familiar 50% scale while the other is on a 100 scale.
When you’re creating a new metric, an important thing to test is the reliability/repeatability of that metric (not technically the same thing, I know, but for the purposes of this articled it is). If a metric isn’t reliable/repeatable, then it’s just measuring random events and isn’t actually telling you anything useful for prediction going forward. If it is reliable, then those metrics may be useful in predicting future results and can be used to try and help build or improve a hockey team.
In Eric’s initial post, dealing only with data for the Flyers, Eric found that neutral zone score was a reliable metric: the best players in the neutral zone on the Flyers in half of his sample were the best players in the other half. But with offensive and defensive zone scores, he couldn’t find any repeatability: Splitting his sample into even and odd games, he found basically no correlation between offensive and defensive zone results between the two samples. In Open play for these players, it seemed offensive and defensive zone results were basically random.
This would be a startling result if true, and Eric noted that his results were limited to the Flyers at first. I’ve taken a look here at hockey-graphs last year at 2 other teams and found that they seemed to show some repeatability which Eric didn’t find in the Flyers. But the problem was that we didn’t have a full data set of neutral zone results for the full league, so we couldn’t really explore further.
Except we now do have such a dataset. Corey Sznajder (@Shutdownline) spent all of last year tracking EVERY team in the NHL, and before he was hired by a team he left us a dataset of neutral zone results for every team in the league. The dataset isn’t complete – 5 teams are finished and the rest are 75% done – but it is big enough to give us a better picture of the neutral zone. In addition, whereas previous work dealt with data from separate trackers, this dataset was entirely done by Corey, which reduces the issue of “Tracker Bias.” Neutral Zone tracking requires some discretion, and as a result different trackers will have slightly different definitions for carry-ins, dumps, or entries altogether, which makes it more difficult to compare the data. Since Corey did this project all himself, we eliminate much of that issue.
So I took Corey’s dataset and divided each team’s data into odd and even games to compare against each other. First, I took a look at whether teams are able to repeat their team performance in all three zones during open play:
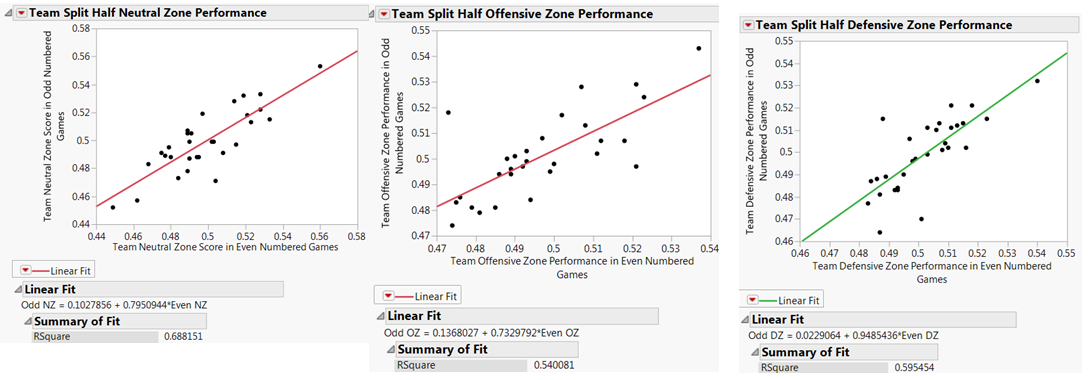
Above are team split half correlations for neutral, offensive, and defensive zone scores. You can see from the graphs and the R Squared results that there are pretty obvious correlations here.
In other words, teams that are good in the offensive, defensive, or neutral zones are likely to remain good at play in those zones. So if you’re a team like the Sharks, who were elite in the offensive zone in 13-14, you shouldn’t be surprised if they remained great at the offensive zone if all else remained the same. This seems like it should be obvious, but it’s not what Eric’s results would suggest: Teams do seem to have control over their results in the offensive and defensive zone, as well as the neutral zone.
Okay, so teams have control over performance in these zones and their numbers over half-season sample sizes are largely the results of skill, not luck. How about individual players? Remember, Eric’s findings for Philly concerned the individual players.
Well, let’s look at the split-half results of individual players, as seen in the graphs below:
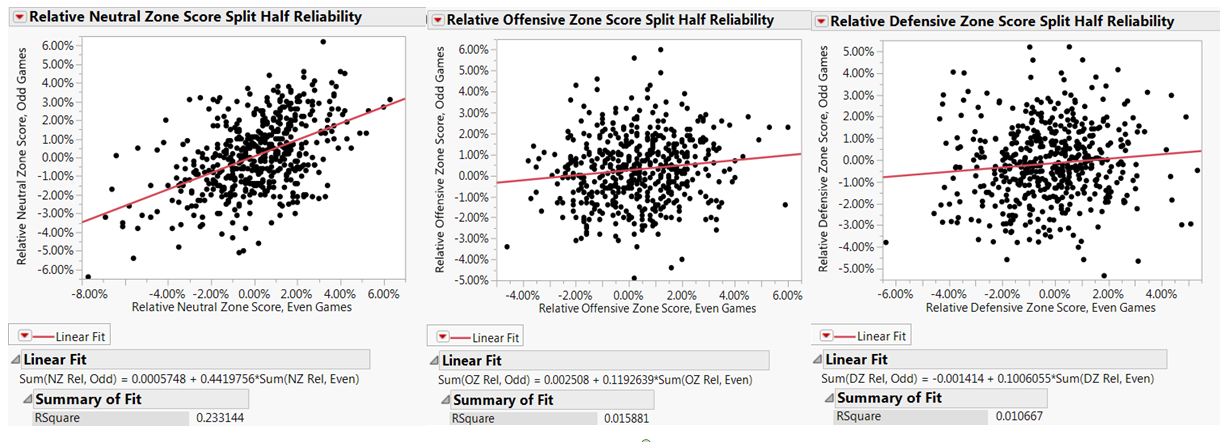
The above graphs again show the performance in each of the three zones of each individual player in even games on the X axis and in odd games on the Y axis. Note that the metrics being used this time are “Relative” metrics (Relative Neutral Zone Score, Relative Offensive Zone Score, etc) – we’re basically seeing if the best players on a team in each of the three zones is consistently so or whether performance within a team is mostly random. The reason for this is to strip out the team effects that we know exist above.
The result looks practically nothing like the team correlations above. Individual Offensive and Defensive Zone Performance, at least in terms of driving possession, is pretty much completely random over a half season. In other words individual players do not demonstrate skill over a half season sample in creating more shots than the average player per type of entry in the offensive zone (or preventing more shots in the defensive zone).
Neutral Zone Performance DOES show some split-half correlation, although it’s not terribly strong. Still there’s clearly some skill in driving play through neutral zone play for individuals over a half season sample. So while that player who gets more shots per carry-in in the first half of a season is unlikely to repeat that feat, a player who causes his team to win the neutral zone in the first half may very well be able to.
Conclusion:
In short, for individuals, Eric’s initial findings appear to be confirmed (at least over the 13-14 season) – Individual players show some control over their teams’ performance in the neutral zone, but not over their teams’ ability to get/prevent shots on net in the offensive/defensive zones. That individual player who is weak in the neutral zone but seems to get loose pucks in the other two zones probably isn’t going to keep making up for his bad neutral zone play in that fashion for long.
That said, on a team level, Eric’s initial findings are NOT correct. Teams do have the ability to drive possession in the offensive and defensive zone. This suggests highly that systems and coaches matter, and that a team can survive without winning the neutral zone (San Jose). With several coaches known for particular systems having moved this offseason (McLellan and DeBoer), it should be interesting to see if these system traits carry over.
I’m planning on going further into repeatability of neutral zone stats soon, focusing upon the micro-aspects of the neutral zone (% of entries by a team, % by carry, % of opponents’ entries by carry, shots per entry), in further posts this summer. Hopefully we can shed light on what’s really going on here, or at least get a clearer picture.

This is extraordinary work. I mean, I’ve always been a skeptic of the impact of coach systems, but most of my critique was based on chance generation in the offensive zone. I can certainly see how that can co-exist with your contention that zone entry (and defending zone entry) can be exemplary of a coach’s system, and can have a positive or negative impact. Very cool.