

Did you really think I was going to miss the opportunity to post the AMac with chains gif again? You thought wrong.
Islander Defenseman Andrew MacDonald is one of the hot names being bounced around during the trade deadline. On one hand, this makes sense: He’s making basically nothing on his current contract, he’s one of the time on ice leaders in the NHL this year and has handled top level competition for a few years now.
On the other hand, his conventional fancystats show a well…..massive decline:

Yikes. That 2013-2014 number is downright terrible, dropping MacDonald into the bottom tier of defensemen. And no zone starts and certainly not competition (see this article for an analysis of AMac vs various levels of competition) does not account for this. If you believed the fancystats, AMac isn’t just not a top tier DMan, but not even a 2nd or 3rd pairing guy who could help any team at all. Yet teams seem to believe he’s worth a high pick? So what’s going on? Is the conventional thought completely wrong here?
Definitely a little, but perhaps not completely. One of the nice things about tracking zone entries, is that we can get a breakdown of the team’s play with a player on the ice in not just the neutral zone, but also in the offensive and defensive zones. Looking at Andrew MacDonald reveals the following:
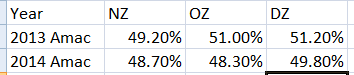
The above #s show AMac’s performance in the neutral zone (Neutral Zone Fenwick), Offensive Zone, and Defensive Zone. The OZone and DZone #s reflect how well the team does compared to how they should be expected to in those zones based upon the neutral zone entries made and allowed. If a player allows a lot of carries but allows a lower amount of shots than normal on those carries, their DZone performance will be above 50% (see last year for AMac). The OZone # is derived the same way.
So we can see quite clearly the reason for AMac’s collapse: Amac’s bad #s last year masked pretty good offensive zone and defensive zone #s – really all of his issues were in the neutral zone, where he allows opponents to carry-in very easily.
But this year, his Defensive #s have fallen to average, and his offensive zone #s have completely tanked (meanwhile, his neutral zone #s have gotten worse as well). This seems like a bad thing to find in a player……
Only not as much as you’d think. As Eric Tulsky found in his original post on Neutral Zone results, O Zone and Defensive Zone results are a lot less repeatable than Neutral Zone #s. See the following graph for example:
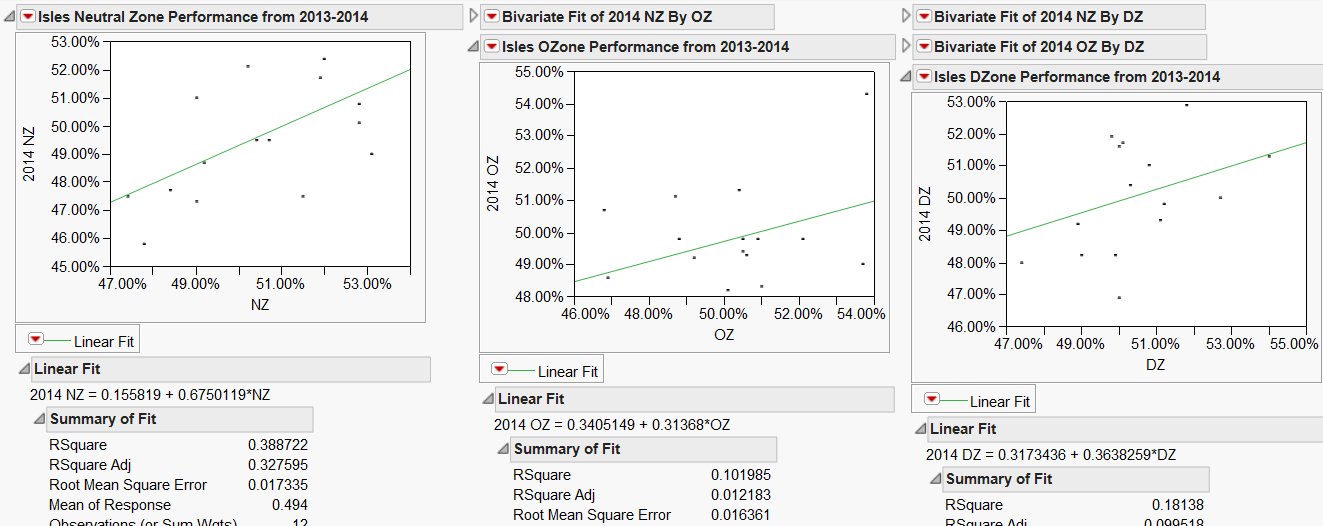
While Neutral Zone performance is decently repeatable from 2013 to 2014, OZone and DZone performance is very random. In other words, for possession’s sake at least, it seems bad OZone and DZone #s are quite likely to be luck instead of a tanking in skill (and the same for good #s).
What does this mean for Andrew MacDonald? Well, for one it means he’s certainly not as bad as he looks right now. He’s probably not as good as he looked last year either, which wasn’t exactly decent (last year he had GOOD luck!) but he’s probably not as horrible as he is in current fancy stats.
—————————————————————
None of this is a great explanation for why scouts and GMs seem to think Andrew MacDonald has some value – my bet is that he’s acquired by a team for at least a 2nd round pick. And that answer may indeed be the answer that teams are still swayed by blocked shots (note that the above #s are all FENWICK, so AMac is getting full credit for his blocking of shots!).
But I think it’s worth noting that the current #s saying AMac is historically bad are driven in large part due to bad luck in the offensive and defensive zones, causing his possession #s to nosedive quite a bit. He may in fact be a reasonable 3rd pair defenseman. Of course, those guys don’t really have much value anyhow.
