
During the offseason, the Toronto Maple Leafs made two small additions to their blueline that were lauded by many in the analytics community. At the draft they traded a fourth round pick and a low-tier prospect for Martin Marincin and on the first day of free agency they signed Matt Hunwick to a low money two-year deal.
Both players had very similar trajectories over the previous three seasons. Marincin had a relative shots percentage of +4.3 while playing 15.7 minutes per night while Hunwick landed at +2.8 percent playing 15.3 minutes. Looking at just the 2014-15 season, Hunwick had the edge at +5.1 in 14.3 minutes to Marincin’s +2.4 in 16.1 minutes. Basically, the Leafs acquired two decent and under-appreciated defensemen who have shown ability to push play in the right direction and for a relatively low cost too.
Flash forward to the culmination of their first seasons as Leafs and opinions of the two couldn’t be more different. Marincin is praised regularly while Hunwick is seen as a proverbial boat anchor.
So what’s changed exactly?
Other than watching both players more frequently now that they’re on the same team, there’s the fact that only one is pushing play as advertised. Marincin is second on the team among d-men with a 53.1 shots percentage (+2.6 rel) while Hunwick is dead last at 47.4 percent (-4.8 rel).
Hunwick has basically gone from really good numbers to really bad ones in the blink of an eye and while a natural decline is possible, Hunwick’s is the largest of any defenseman this season so there’s likely more to it.
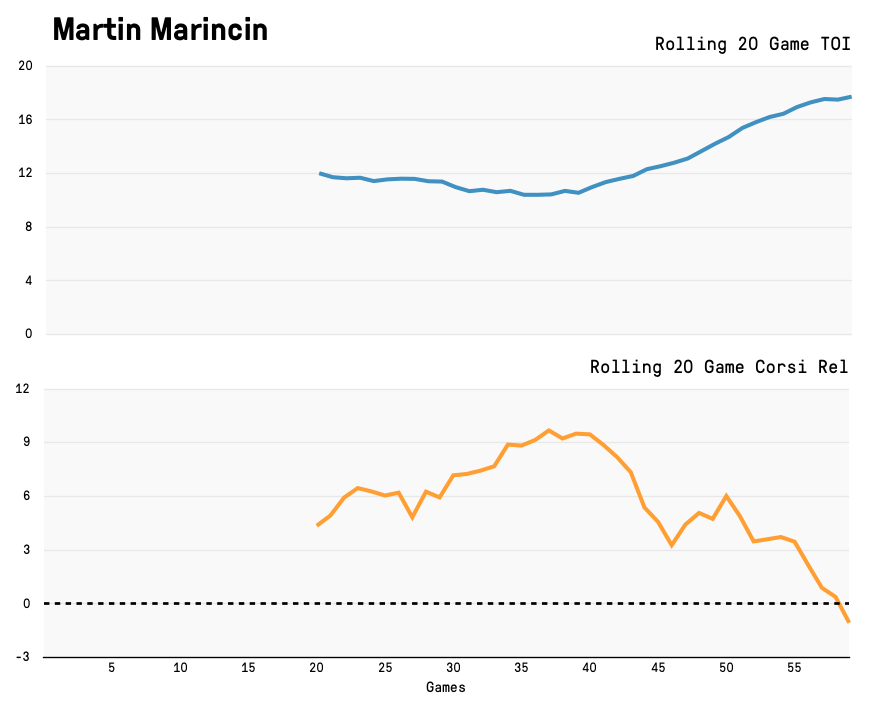
Hunwick has gone from playing 14.3 minutes per night last season to 17.6 minutes this season and is being used in a shutdown role along with Morgan Rielly. He was thrust into that role from the get-go so it’s not immediately apparent whether that’s what caused the drop, but his relative Corsi has been mostly steady all season.

Marincin is a different story. He was used sparingly by Mike Babcock early in the season, despite dominating the shot clock regularly. After Dion Phaneuf and Roman Polak were traded, he started seeing more ice-time, though his relative Corsi dropped in lock step. Before Phaneuf was traded, his Corsi rel was +6.2 percent playing 11.3 minutes. After the trade, his minutes rose to 16.8 while his Corsi rel dropped to +0.7 percent.
It’s an interesting trend, but what does it really mean?
Well, nothing yet at least. It’s anecdotal evidence that two players took a hit in their shot results that coincided with an increase or decrease in time-on-ice. While it does make some intuitive sense that some minutes can be easier than others and the results will reflect that, this could just be a random happenstance.
What I do think it points to is the possibility that quality of competition is more important than it’s been previously shown to be. Current research has suggested that it doesn’t move the needle very much because the range of competition is small and that quality of teammates trumps its effect. I think the latter is mostly true, but the former isn’t and it’s because of how it’s measured.
There’s currently two competition metrics out there. One uses Corsi or Corsi Rel, and the other uses TOI or TOI%. There’s two problems with both.
The first is that both measures combine forward competition and defensemen competition. Separating the two was something originally championed by stats pioneer Eric Tulsky, but it hasn’t been widely adopted.
My suspicion is that most d-men will see a much larger range in the forwards they play as opposed to the d-men they face. Thankfully, Hockey Graphs’ Muneeb Alam has an interactive visualization on Tableau that shows the range for defensemen in forwards faced is about twice as large as it is for defensemen faced this season. Combining the two positions together for competition would likely dilute those differences.
It also ignores the roles that players play. A coach that is trying to shutdown its opposition’s top scoring line might go power vs. power, or he might send out a checking line and shutdown pair (which may be the second pair, not the top pair). Every coach has a different deployment strategy based on role and that further nullifies the range.
The second issue is based on how a coach gives out minutes.
Think like an NHL coach for a second. You’ve got your shutdown pair, but how do you decide who to match them up against? You’re probably not using Corsi (explicitly, at least) and you’re probably not using ice-time either (but you’ll be close). What you do know is which guys create the most offence. You know Sidney Crosby or Tyler Seguin are the guys to shut down, not because they get the most ice-time or because of their Corsi, but because they can score and make plays, sometimes at will, something that’s reflected in their point totals.
So what happens when we measure the quality of forwards faced by a defensemen this season using points instead? (And not just this year’s points, because you’re a smart coach who understands year-to-year variance. Instead we’ll use a the last three seasons – weighted for recency and regressed to the mean based on how many minutes they’ve played). As it turns out, the range (as measured versus the metric’s observed range) is in fact larger.
Special thanks to Muneeb for collecting all the individual competition data and sharing it with me.
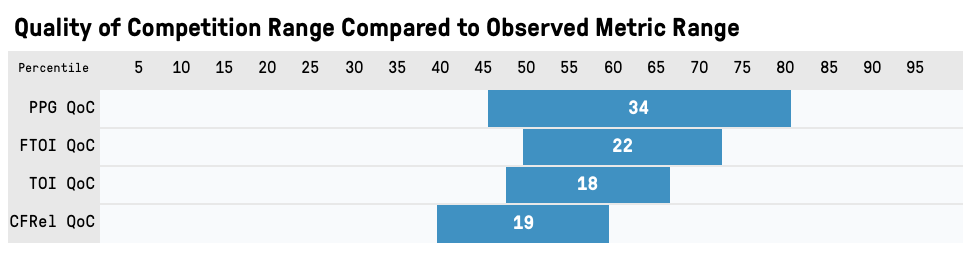
The range for PPG QoC goes from 0.37 to 0.57 which covers 34 percent of the range for points-per-game which goes from 0.09 to 1.11. It’s still not huge, but it’s a 55 percent increase over what we currently observe.
Unsurprisingly, the difference in competition relates closely with 5-on-5 ice-time where we see top four d-men mostly play against second line competition on average, while bottom pairing and replacement level guys mostly face third line competition on average.

The toughest competition in the league? Matt Hunwick. The average forward Hunwick faces is a 47 point guy. Marincin, meanwhile, faces a 35 point forward on average which is the 188th toughest comp among 222 d-men. That’s a pretty big difference.
We can also look at the type of forwards faced: top six, bottom six, and leftovers. About 68 percent of forwards Hunwick faces are players that score at a top-six rate. That number for Marincin is 40 percent. Toronto actually has the largest competition spread of any team in the league on their back-end among the main seven players they’ve used this season.
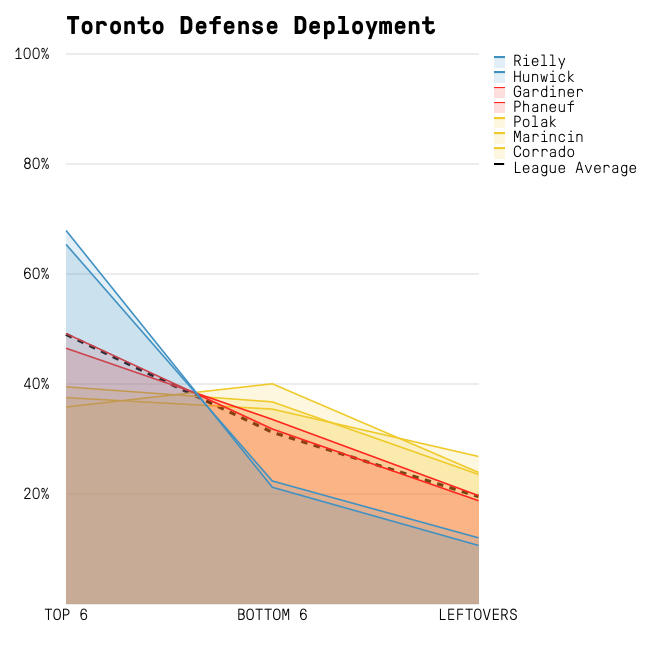
There’s only six players league-wide that face top six forwards more than 65 percent of the time: Matt Hunwick, Morgan Rielly, Niklas Hjalmarsson, Ryan McDonagh, Erik Johnson and Francois Beauchemin. There’s roughly 30 d-men each in the above 60 percent or below 40 percent range meaning that most d-men reside in the 40-60 percent range for top-six scorers.
Which begs the question, how much does this actually matter? That’s a lot tougher to answer. There’s so many confounding variables to consider that it’s difficult to extract one piece of context and judge how important it is, especially considering they’re all acting simultaneously upon each other.
Still, any effect should likely be accounted for in some way even if they’re all tiny. It’s sort of like a hockey version of death by a thousand cuts: extreme zone starts may have a small effect, extreme competition may have a small effect, poor teammates may have a small effect, but all three at once might have a bigger effect combined than we might realize.
So far we’ve been measuring that effect on shot rates – mostly because of how noisy everything else is – but with regards to quality of competition how often those shots go in are perhaps equally important considering the fact that players who score more often are those that are concentrated at the top of the lineup. (This goes for teammate quality too).
The range for Corsi between the three groups is 47.7 for the scrubs and 51.5 percent for the top-six scorers with the biggest changes coming from shot generation. For goals, it’s 43.3 – 53.5 percent, almost entirely thanks to an average shooting percentage range of 6 – 8.5 percent.
Goal stats are notoriously tricky to deal with because of small sample size and variance, and because of that we’re likely missing a large part of possible teammate and competition effects in our analysis.
There’s so many factors that go into a player’s results that I don’t think we fully understand just yet. We’ve got a good idea, but it’s an extremely elaborate web that’s still being untangled. How the other nine players on the ice affect a single player is perhaps one of the biggest hurdles left to tackle.
The big thing is we shouldn’t dismiss the five guys skating in different colours. They matter. Yes, who you play with will generally be more consistent and have a larger effect than who you play against, but both should be accounted for in some way. It’s likely that the two affect different players in different ways.
Elite players can play with or against anybody with ease. Then there’s players who need a little help from their teammates to stay afloat against skilled players. Then there’s those who simply can’t handle the heat, no matter who they play with. Matt Hunwick probably fits that bill.
Or maybe he’s just shouldering the burden so others can feast. Martin Marincin may have looked a lot better than him throughout this season, but Hunwick deserves some credit for eating tougher minutes (theoretically anyways) and creating an easier environment for him to play in.
With that being said, it’s clear that some minutes – for d-men at least – are in fact easier than others, with a range much larger than what’s been previously measured. How much easier it actually makes things is still left to be determined.
Stats from corsica.hockey and war-on-ice.com
Other QoC References
The Importance of Quality of Competition by Eric Tulsky
The relationship between competition and observed results is real and it’s spectacular by Petbugs
How much does matching competition matter on a team level? by Garik16
Why linemate and competition metrics may not be as simple as we think by Garret Hohl
Teammate/Competition Viz by Micah Blake McCurdy

Yes, quality of competition does matter. Few teams spread out their D against all lines, Leafs are no different. They play Marincin and Gardiner more against back-end players because their in-house stats show they are worse than Rielly/Hunwick against top end players.
Playing often against players good at scoring is not a negative on corsi numbers as said competition is not necessarily good at the possession aspect of the game.
In addition, CF%Rel is based on how you perform relative to your teammates. If a boat anchor you weren’t playing with is replaced, it’s fair to assume it’ll be tougher to look quite as good relative to your teammates because they’ll be a better possession group.