
In March 2018, Shawn Ferris of Hockey Graphs introduced his NWHL Game Score, which was based on Dom Luszczyszyn’s NHL Game Score. It was groundbreaking work in women’s hockey analytics, which is still very much in its infancy — especially at the professional level.
Game score is a valuable tool that can give us a better understanding of a player’s performance than points for skaters or save percentage and goals against average for goaltenders. It provides us with a single value that incorporates relevant points of data which we can use to compare the performances of two or more players in a single game or over the course of many games, including seasons and careers.
As Shawn noted in his work, game score is particularly valuable for analyzing performance in the NWHL because of the brevity of the regular season. Through the league’s first four seasons, the average length of a season was under 18 games. The 2019-20 season promises a schedule of 24 games, which is still less than a third of the length of the NHL season. That brief schedule creates an opportunity for shooting percentage factors to influence both a players’ production and our perception of their performance.
Method
The methodology behind this revised NWHL game score is relatively straightforward. The idea is to compare all of a player’s valuable events to the frequency in which goals are scored. The problem with crafting a game score for the NWHL is that there aren’t many stats at our disposal. However, we have more data today than we did when Shawn started his work.
Unfortunately, like Shawn, I found that the NWHL’s blocked shot data was problematic. Not only are blocked shots subjective to those who track them, there are also instances where blocked shots can’t be found in certain NWHL box scores. As a result, they were left on the cutting room floor along with turnovers — the NWHL’s other real-time stat.
I have been independently tracking primary point production and other stats in the NWHL since the league’s inaugural season. To build upon Shawn’s initial NWHL game score formula, I added primary and secondary assists and two more years of data to his work. Just like Dom and Shawn did for their game scores, I adjusted the value of primary and secondary assists against the frequency of goals. Adding two more seasons of data changed the initial weights that Shawn had for shots on goal, faceoffs, and penalties taken.
The result was the following Game Score:
Skater Game Score = G + (.90*A1) + (.66*A2) + (.10*SOG) + (.11*FOW) – (.11*FOL) – (.15*PENT)
For goalies, I compared goalie game scores per 60 minutes (GS/60) to skater game scores per game (GS/GP) to find a fair value for saves. Without taking this measure, goalies become very undervalued. Given how crucial goaltenders are to the outcome of any game, there is definitely a case to be made that saves should carry even more value.
Goalie Game Score = (.15*SV) – GA
Testing
Shawn’s work proved that game score was more repeatable than points, which results in it being a more valuable tool for evaluating performance.
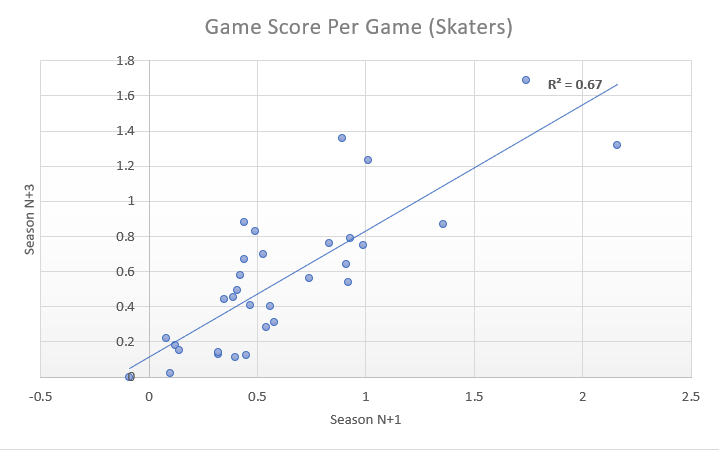
With my updated formula, I hoped to find that the inclusion of more data, particularly the distinction between primary and secondary assists, would give us a game score that was more accurate at predicting performance. If it proves to be more predictive, it may suggest that it would be a more effective tool than Shawn’s original NWHL game score.
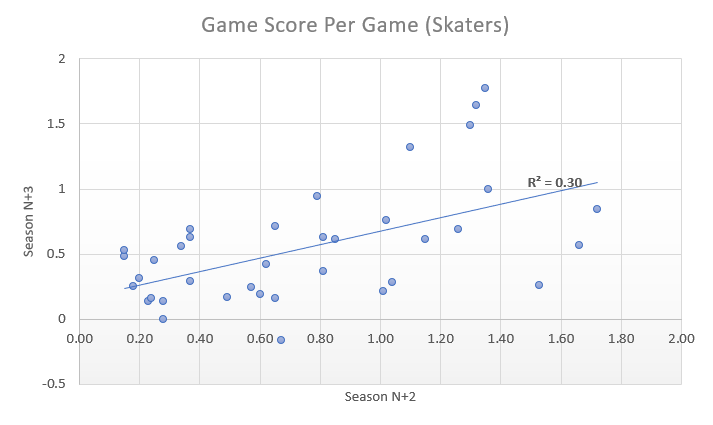
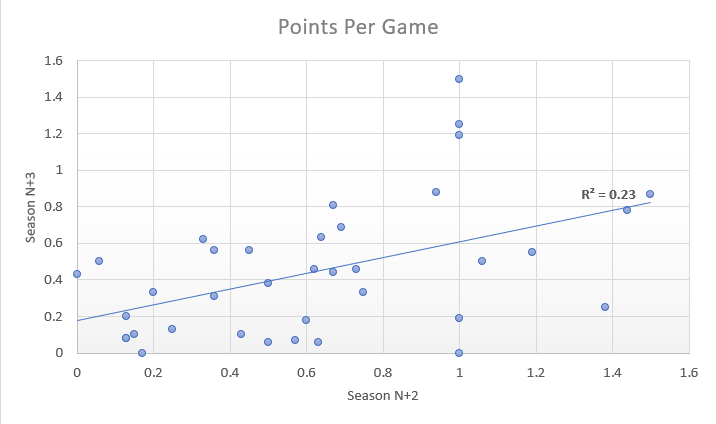
All charts in testing were done at the player level.
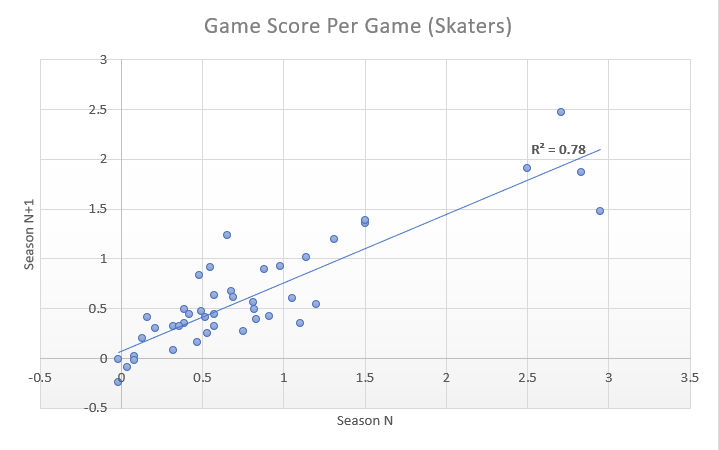
As you can see above, the updated game score has a greater squared correlation between the 2015-16 and 2016-17 seasons than the original NWHL game score (0.72). With that being said, it is not a dramatic improvement. This is likely due to the fact that the new formula is more or less just a minor tweak of Shawn’s existing work.
We can also conclude that primary point production is more repeatable than point production because of the impact that splitting apart primary and secondary assists had on game score repeatability. This may not sound like a groundbreaking revelation to those who are familiar with data analysis in men’s professional hockey, but it is significant to see it translate to the women’s game. It also serves as proof of the value behind primary assists and why they are a statistic we need to pay attention to in the women’s game at every level.
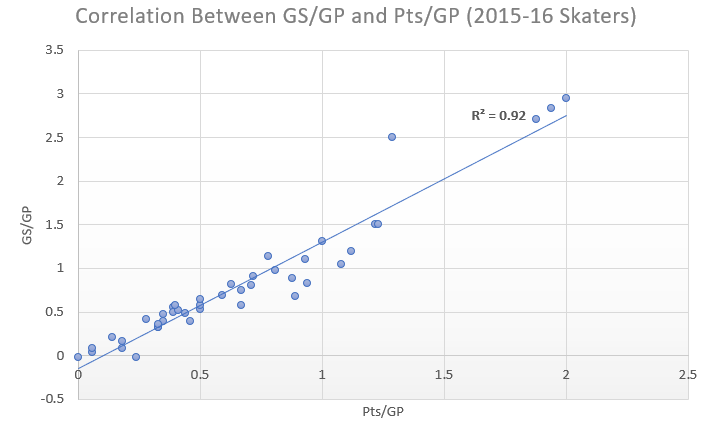
Unsurprisingly, a strong correlation still exists between points per-game and game score per-game. I expected this because of how much weight goals and assists have in both Shawn’s formula and my own.
Regarding the 2017-18 NWHL Season
As Alyssa Longmuir examined in a detailed piece that she wrote for The Ice Garden in May 2018, centralization played a dramatic role on the landscape of talent in the NWHL in the 2017-18 season. Members of the United States women’s national team left the league to prepare for the Pyeongchang Olympics, depriving the league of the bulk of its elite players. Furthermore, a high number of NCAA D-III alumnae joined rosters to help fill the holes left by absent national team players.
The radical change in the talent pool has made the 2017-18 season statistically aberrant. The league-wide shooting percentage dipped to an all-time low of 9.58 percent — down from 10.57 percent through the first two seasons. Goals and shots per-game also hit all-time lows. Many returning players flourished in a league without national team players and set career highs in points. As you might imagine, the sudden change in the landscape of talent wreaked havoc on the predictability of game score. However, it still proved to have a higher repeatability than points per-game.
Weaknesses
Much like Shawn observed in his work, this new approach to game score still favors centers who both excel at faceoffs and see a lot of ice time. Moreover, the data we use to analyze the performance of skaters greatly skews in favor of top-six forwards and offensive defenders. Because blocked shot data has proven to be unreliable, there are currently no stats outside of on-ice goal differential (5-on-5) to help illustrate the performance of defenders beyond point production and getting shots on net. Therefore, for defenders, game score is more of a starting point for analysis than a one-stat-tells-all.
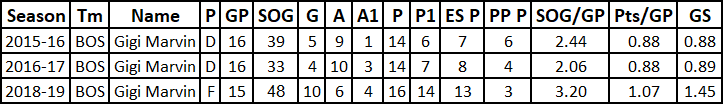
A convincing example that helps to illustrate how game score is skewed in favor of forwards, especially centers, is the jump in Gigi Marvin’s GS/GP last season. Marvin had nearly identical average game scores playing as a defender in 2015-16 (0.88) and 2016-17 (0.89), but when she returned to the NWHL in 2018-19 as a forward, her GS/GP rose dramatically (1.45).
Unfortunately, there are several factors that ultimately limit how we can use game score with goaltenders. Together, the brevity of the NWHL season, the size of the league, and frequent roster turnover result in an inadequate amount of data for predicting goaltending performance with game score. As things currently stand, there just isn’t enough data to test for repeatability.
Clearly, there is work to be done in regards to finding a better way to analyze goalie performance in women’s hockey.
Next Steps
Although this current iteration of game score has proven to be more useful for player evaluation and predicting performance than points per-game, there is still a lot of work to be done. One of the first steps is to incorporate Daniel Weber’s data on penalties drawn, which he began with the 2018-19 season. This is particularly advantageous because it not only incorporates individual penalty differential, but also rewards players who earn power plays for their team.
Skater Game Score = G + (.90*A1) + (.66*A2) + (.10*SOG) + (.11*FOW) – (.11*FOL) – (.15*PENT) + (.15*PEND)
Some of the next steps we can take could make game score a more insightful tool for evaluating defenders. As I mentioned earlier, the inclusion of on-ice goal differential at 5-on-5 is one way we could try to find a quantitative value for the play of defenders.
Jury-rigging tools that have been created to analyze men’s professional hockey to suit the data we have to work with for women’s professional hockey is not a new practice, but it remains a useful one. Using on-ice goal differential in lieu of Corsi For and Corsi Against — which Dom used for his NHL game score — and adding blocked shots to the formula when we have a more reliable dataset could get us closer to a formula that is less skewed in favor of forwards and especially centers.
The bottom line is that we won’t know until we test it, and we can’t test it without more seasons and more data.
