
Rand Carlyle was recently fired from the Toronto Maple Leafs. This brought joy to many online Leaf fans as many –legitimately– believed Carlyle to be a source of the Maple Leafs consistently being out shot, out possessed, and out chanced.
Of course, Carlyle was not the difference between the Leafs spontaneously becoming a contender in the east. There are issues with the Maple Leafs that will take some time for Brendan Shanahan and company to fix.
For one example, the team lacks depth, especially in effective two-way capable forwards and defenders. This will take time for any team to fix.
Another major example though comes with the issue of deployment and usage.
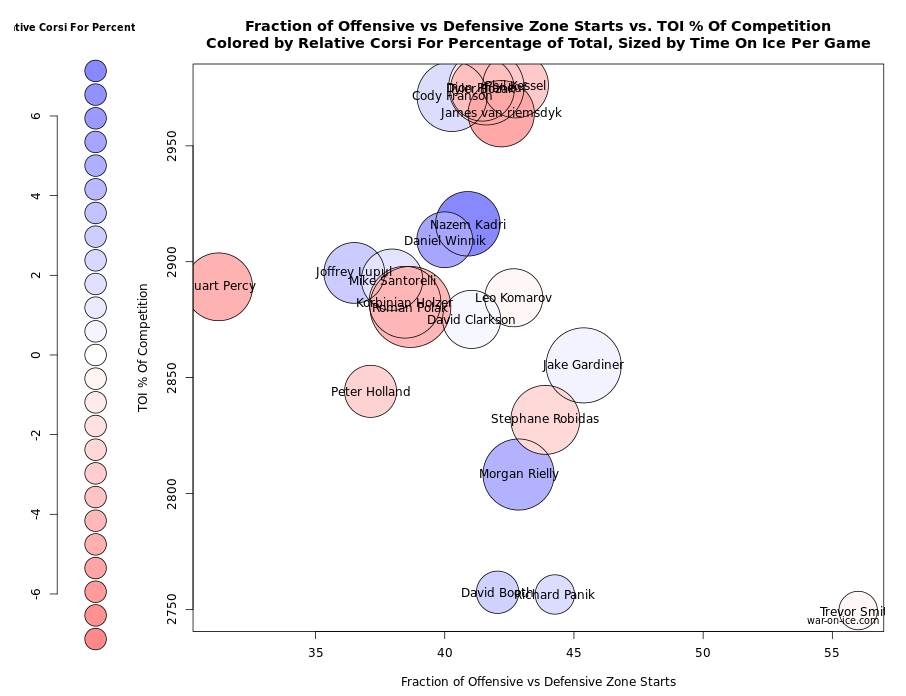
The top players in ice time are the players hurting the team the most. Roman Polak and Dion Phaneuf, James Van Riemsdyk, and Tyler Bozak all play top minutes and are severely below the team’s average in terms of score-adjusted scoring chance differentials.
Of course, sometimes it is okay to have your top players not lead the team in two-way numbers like scoring chances and Corsi percentage. They may be taking tougher assignments which is allowing your weaker players to take up softer assignments. You still want them to be above average since they are takin g the bulk of the minutes.
Due to the greater share in ice time, top lines have a larger impact on goal differentials per Corsi percentage point change than lower lines. Drowning your top line in order to shelter the rest of your team can become problematic, especially if your top line lacks two-way talent like the Leafs.
We can see this issue when charting Leaf forward Corsi percentages when with different defenders, when ordering them by ice time per game:
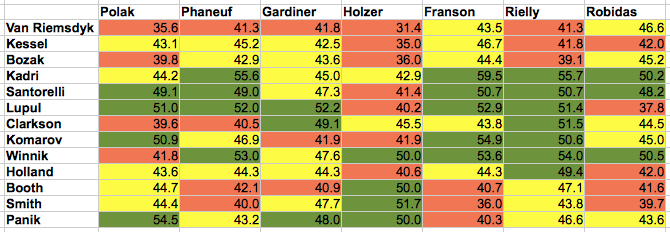
(first 10 seconds of non-neutral zone faceoffs removed to reduce zone deployment effects)
The cells are colour coded so that the bottom third results are in red, while the top third is green. Keep in mind that sample sizes are small due to slicing the data, so trends are more important than the raw results.
Optimally you want the green to be somewhat concentrated in the top left hand side. This technique was initially used by Tyler Dellow to help demonstrate the issues with the Winnipeg Jets came from the lower end of their roster. The Jets had Andrew Ladd, Bryan Little, and Blake Wheeler taking tough minutes with Tobias Enstrom and Dustin Byfuglien, all while beating those tough minutes in above league average fashion.
Instead, the Leafs have a top line that has only two out of twenty one pairs above their team’s median result between the three of them.
Now when you have results like this it doesn’t necessarily always mean that these players with the most minutes are worse than the ones with less (although in this specific situation you likely have that in a few areas, like top six centres). It could simply mean that the load is unevenly distributed. The team should take some of those minutes and difficulty in workload from the drowning top line and redistribute it throughout the team.
The Leafs has already made some adjustments which should help the team in the long run. Recently Nazem Kadri and Daniel Winnik have played some minutes with elite finisher Phil Kessel, which gives them a line which will likely drown less under similar usage.
Analysis like this may be another area that can help the Leafs.
