
The Passing Project headed by fellow Hockey Graphs contributor Ryan Stimson (@RK_Stimp) is one of the most exciting things happening in hockey analytics. The project consists of dozens of volunteers manually tracking the passes that lead to shot attempts in games across the NHL. Thus far, the project has compiled data for nearly five hundred games. Ryan laid the groundwork for analyzing the project’s data in his piece here. That pieces discusses primary shot contributions (PSCs), which is a counting stat comprised of shots and shot assists. Shots in this article is synonymous with corsi meaning all shots and not just shots on goal. Ryan has built on that original work with a piece on offensive zone play here and a piece on neutral zone play here. And following his line of thought, I wrote a piece for NHL Numbers that expanded on his approach to offensive zone analysis.
Reading those pieces prior to advancing with this one is recommended. But as a quick summary, each piece uses the passing project data to inform the types of passing sequences that most frequently lead to goals. Ryan’s offensive zone piece identified behind the net passing as a dangerous method of creating goals and showed its repeatability at a team level. My piece added royal road passes to behind the net passes as another dangerous type of pass tracked by the volunteers in the project. And while royal road passes were not repeatable at the team level (possibly due to small sample size or other factors listed in the article), they are repeatable at an individual level. Based on the findings in that piece, PSCs where the primary shot assist was either a behind the net pass or a royal road pass are deemed dangerous PSCs (DPSCs) because the shooting percentage on those shots is much higher than for other types of shots.
While identifying DPSC as a measure of offensive creativity was positive step, it raised several questions. In a discussion on Twitter, Sean Tierney (another Hockey Graphs contributor) showed a chart indicating Nazem Kadri has one of the highest PSC/60 rates in the league. He is 2nd in the league behind only Tyler Seguin. But by DPSC, Kadri is only in the 59th percentile among forwards. So what does that mean?
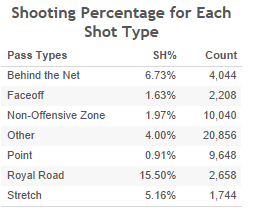
The first logical step in attempting to answer this question is to weight each shot type by its shooting percentage. Doing so creates a shot metric that is weighted by danger according to the data available in the passing project. The project tracks seven different types of passing sequences. Below is a table that shows the different passing sequences and their respective shooting percentages. Because the passing data tracks all shots, the shooting percentage here is based on all shots and not just shots on goal. In total, the data set includes 51,308 shots at 5v5.
Using this method yields three separate measures:
- Weighted primary shot assists
- Weighted shots
- Weighted primary shot contributions
If these measures have value, they should be able to better predict primary assists, goals and primary points than the actual counting stats. The method of testing this idea was to measure the out of sample correlations using the games not yet tracked from last season as the out of sample numbers. For clarity, that means the out of sample data is coming from the same season as opposed to a year over year evaluation. The players included are limited to those who played at least 120 minutes at 5v5 both in and out of sample. Below are the r-squared values for in-sample scoring, PSC and wPSC measured against out of sample scoring for both forwards and defenders. The sample includes 348 forwards and 192 defenders. All of the TOI and scoring data is pulled from corsica.hockey.
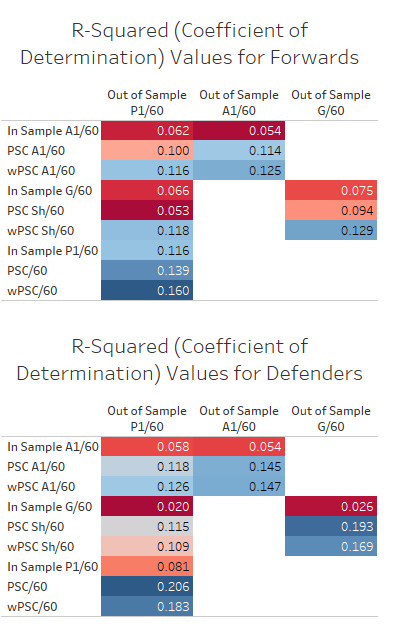
In every instance for forwards, the weighted PSC metric outperforms the scoring and unweighted PSC metric in predicting future performance. But for defenders, unweighted PSC is a better predictor of future scoring. This is likely due to defenders being less likely to make primary shot assists of the most dangerous types, which are behind the net and royal road.
The takeaway here is that for forwards, simply weighting each shot based on the danger relative to the passing sequence preceding the shot is an improvement on the actual measures in predicting future scoring at the player level. This is further indication that more granular data beyond shot metrics are valuable and can offer better abilities to forecast player performance.
Having walked through the process of the calculations, we can now get to the fun part. What do these new metrics say about players? Below is a chart that groups forwards into tiers based on their percentile ranks in weighted primary shot contributions per 60 minutes of TOI. Keep in mind that this is purely an offensive metric and does not consider a player’s defensive impact. Thus, it isn’t a great way of measuring defensive impact. As an example, Patrice Bergeron is one of the best all around forwards in the NHL but he appears less impressive by this measure. Players within each tier are sorted from highest to lowest weighted primary shot contributions per 60 minutes of TOI.

If you’d like to play with data on your own to look up your favorite team or compare players, I’ve made some simple tools that will allow you to do that. First, below is an example of bar graph showing the forwards for the Dallas Stars. You can use the link below the image to filter by any team in the league.

Choose your favorite team tool
If you’re more interested in seeing an individual player or comparing two players, you can use the tool below to do exactly that. Here we see a comparison of Nazem Kadri and Tyler Seguin. Revisiting the question about Kadri from earlier, this graph shows that despite his lack of dangerous primary shot contributions, the volume of shots and primary shot assists is enough to keep Kadri amongst the league leaders in wPSC.

The passing project data is valuable in that it helps measure particular skill sets in ways not previously possible. It allows for better assessment of which players are the most skilled offensively and do the most to contribute to dangerous shots. However, while a weighted primary shots calculation calculation is interesting, it completely ignores half of the game. Luckily, rumor has it that two really smart people might be addressing that exact idea at the Rochester Institute of Technology Hockey Analytics Conference this weekend. So if like me, you can’t make it in person, be sure to check out the live stream.

“But for defenders, unweighted PSC is a better predictor of future scoring. This is likely due to defenders being less likely to make primary shot assists of the most dangerous types, which are behind the net and royal road.”
Not sure I follow that logic. Wouldn’t weighted PSC take the fact that defensemen wouldn’t be creating those dangerous shot assists or shots and adjust accordingly? As it stands, unweighted PSC would consider every shot assist and shot equal which should overestimate defensemen’s point production. I would guess it’s more an issue of the sample size, >120min isn’t a ton for players.
Good read though.